Time window
The time window decides which period the charts on a dashboard show: the last hour, the last 24 hours, last week... It's in the top-right corner of every dashboard.
This is the most common reason. A new dashboard shows only the last hour. If your device sends data every 15 minutes, the chart has just a few points; if it sends once a day, the chart may be empty. Set a longer time window.
Realtime or history
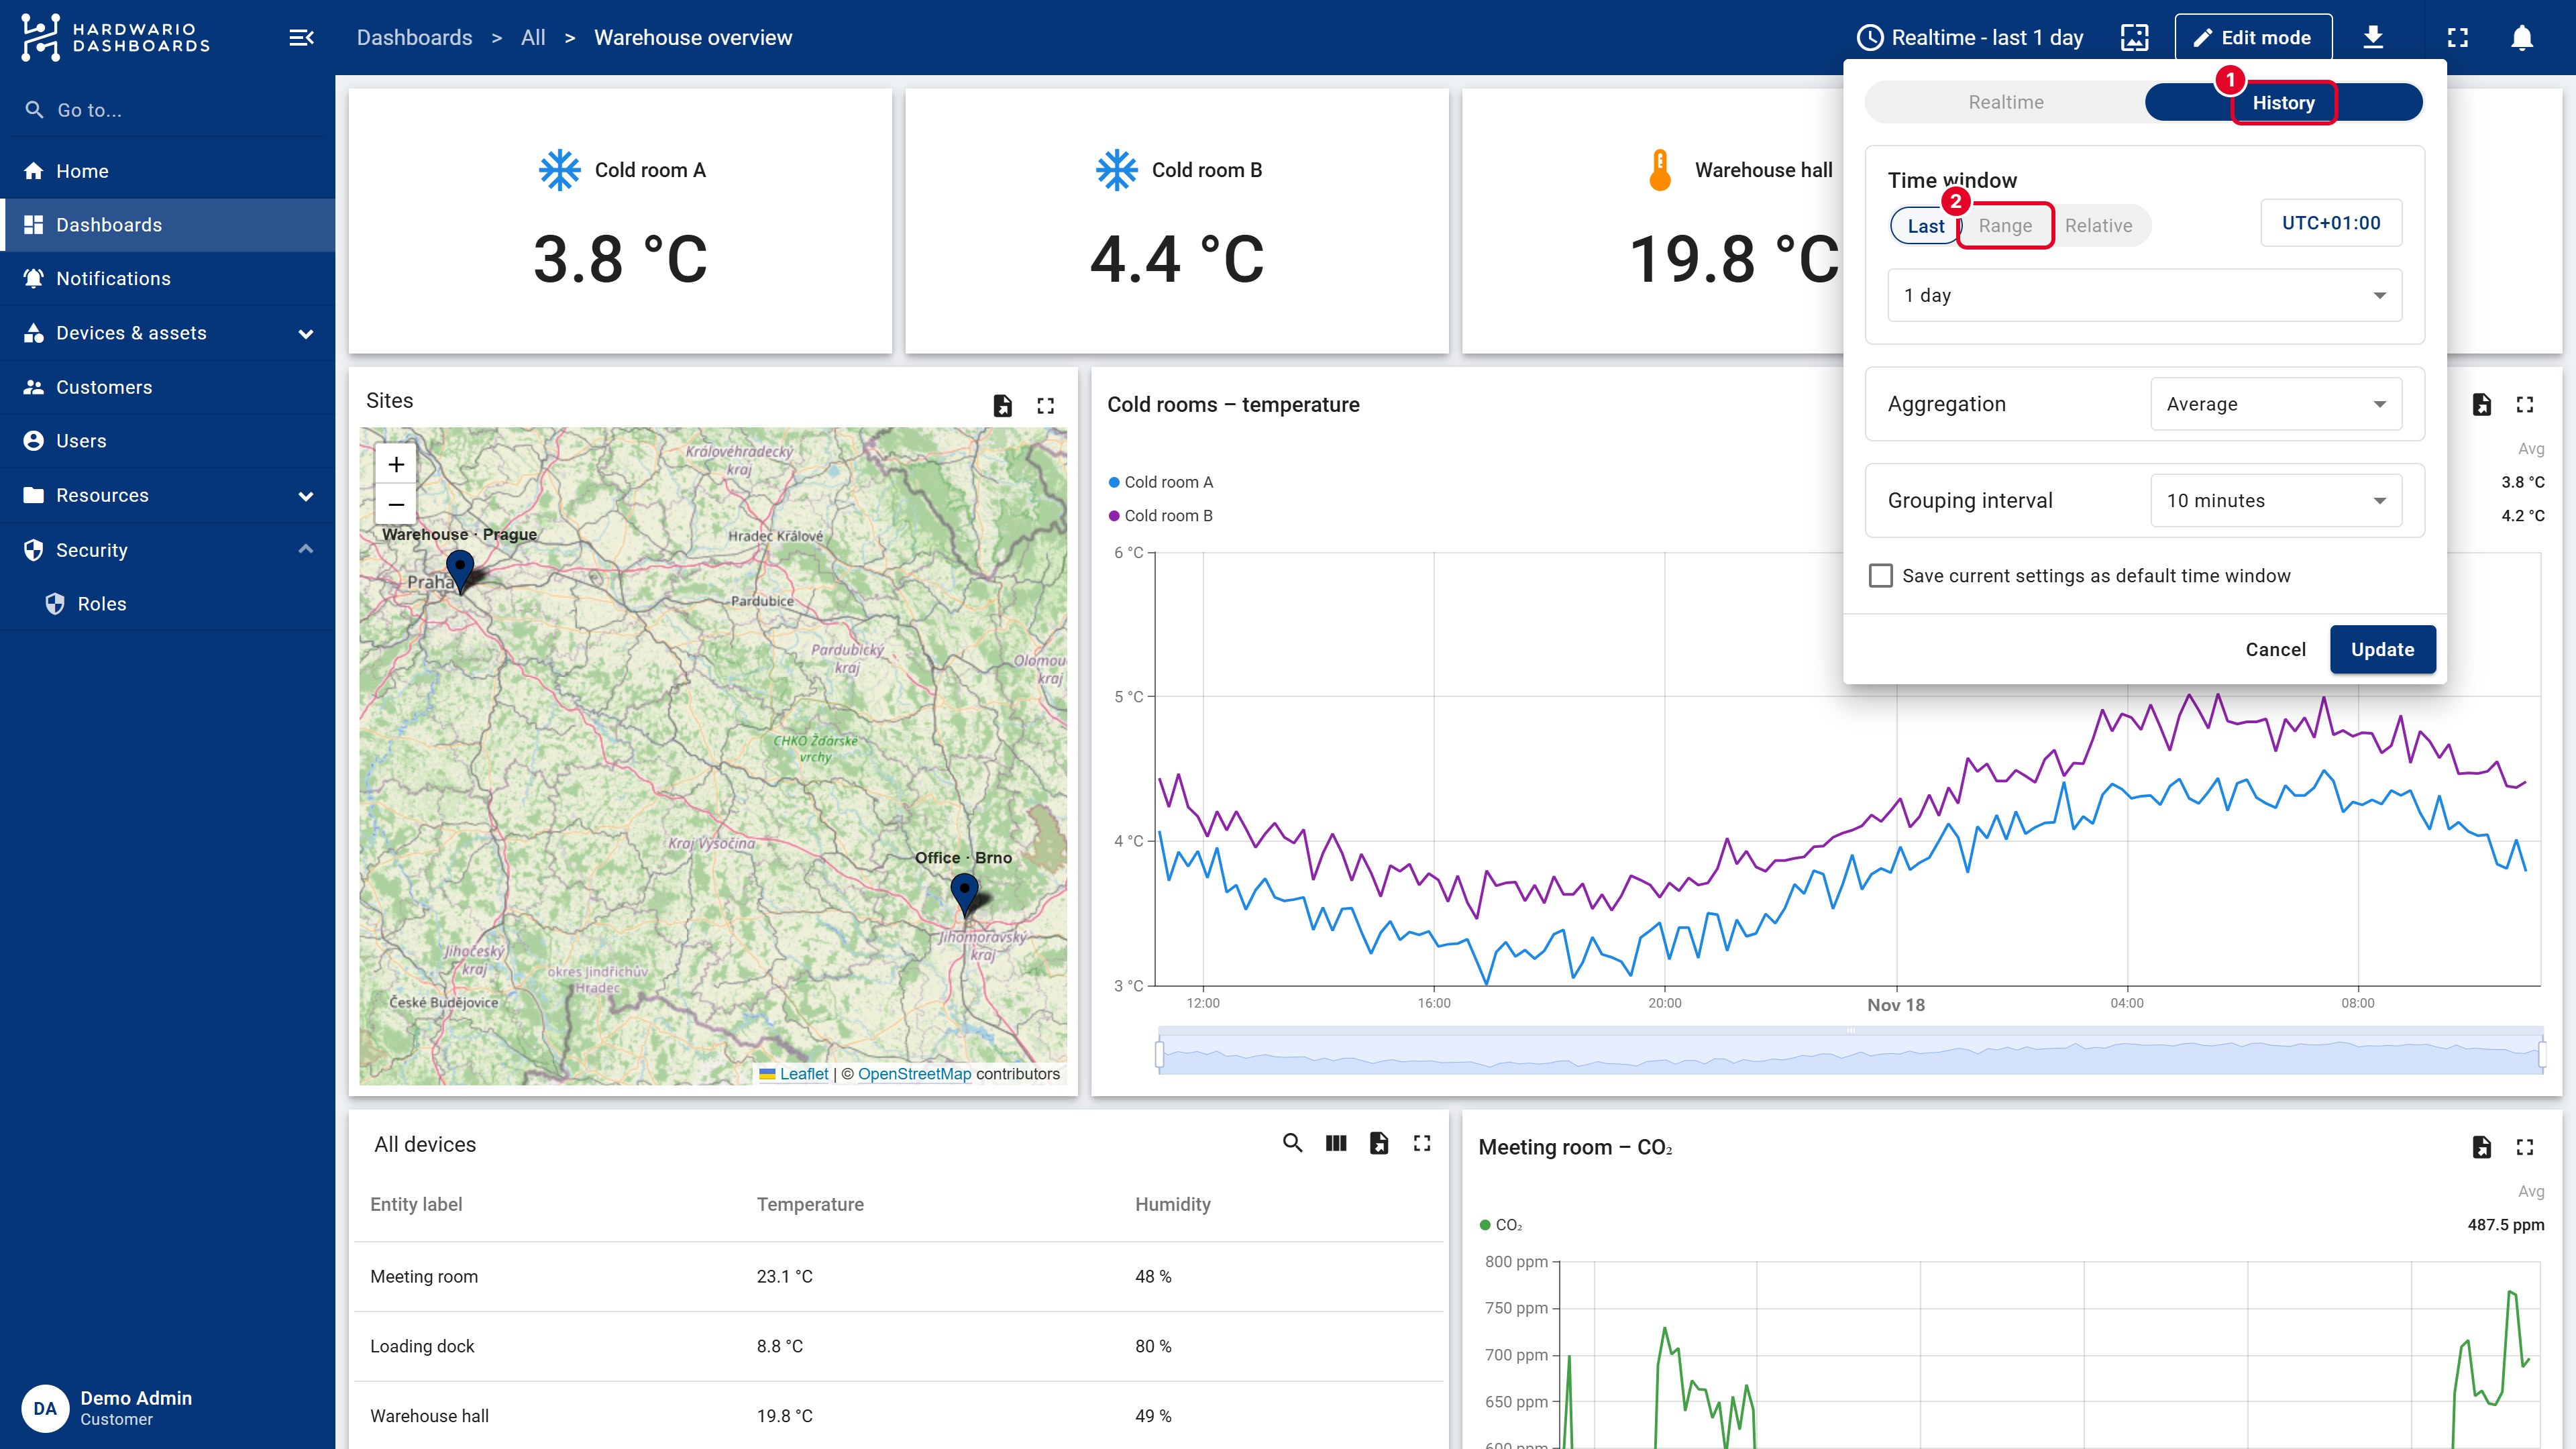
Click the time window in the top bar (for example Realtime - last 1 day). A panel opens with two tabs:
| Tab | What it shows | Example |
|---|---|---|
| Realtime | A period that ends now and keeps moving as new data arrives. | the last 24 hours, the last 7 days |
| History | A fixed period in the past. Choose Range to set the start and end. | last week, 1–31 October |
Choose the period and click Update. All charts on the dashboard redraw.
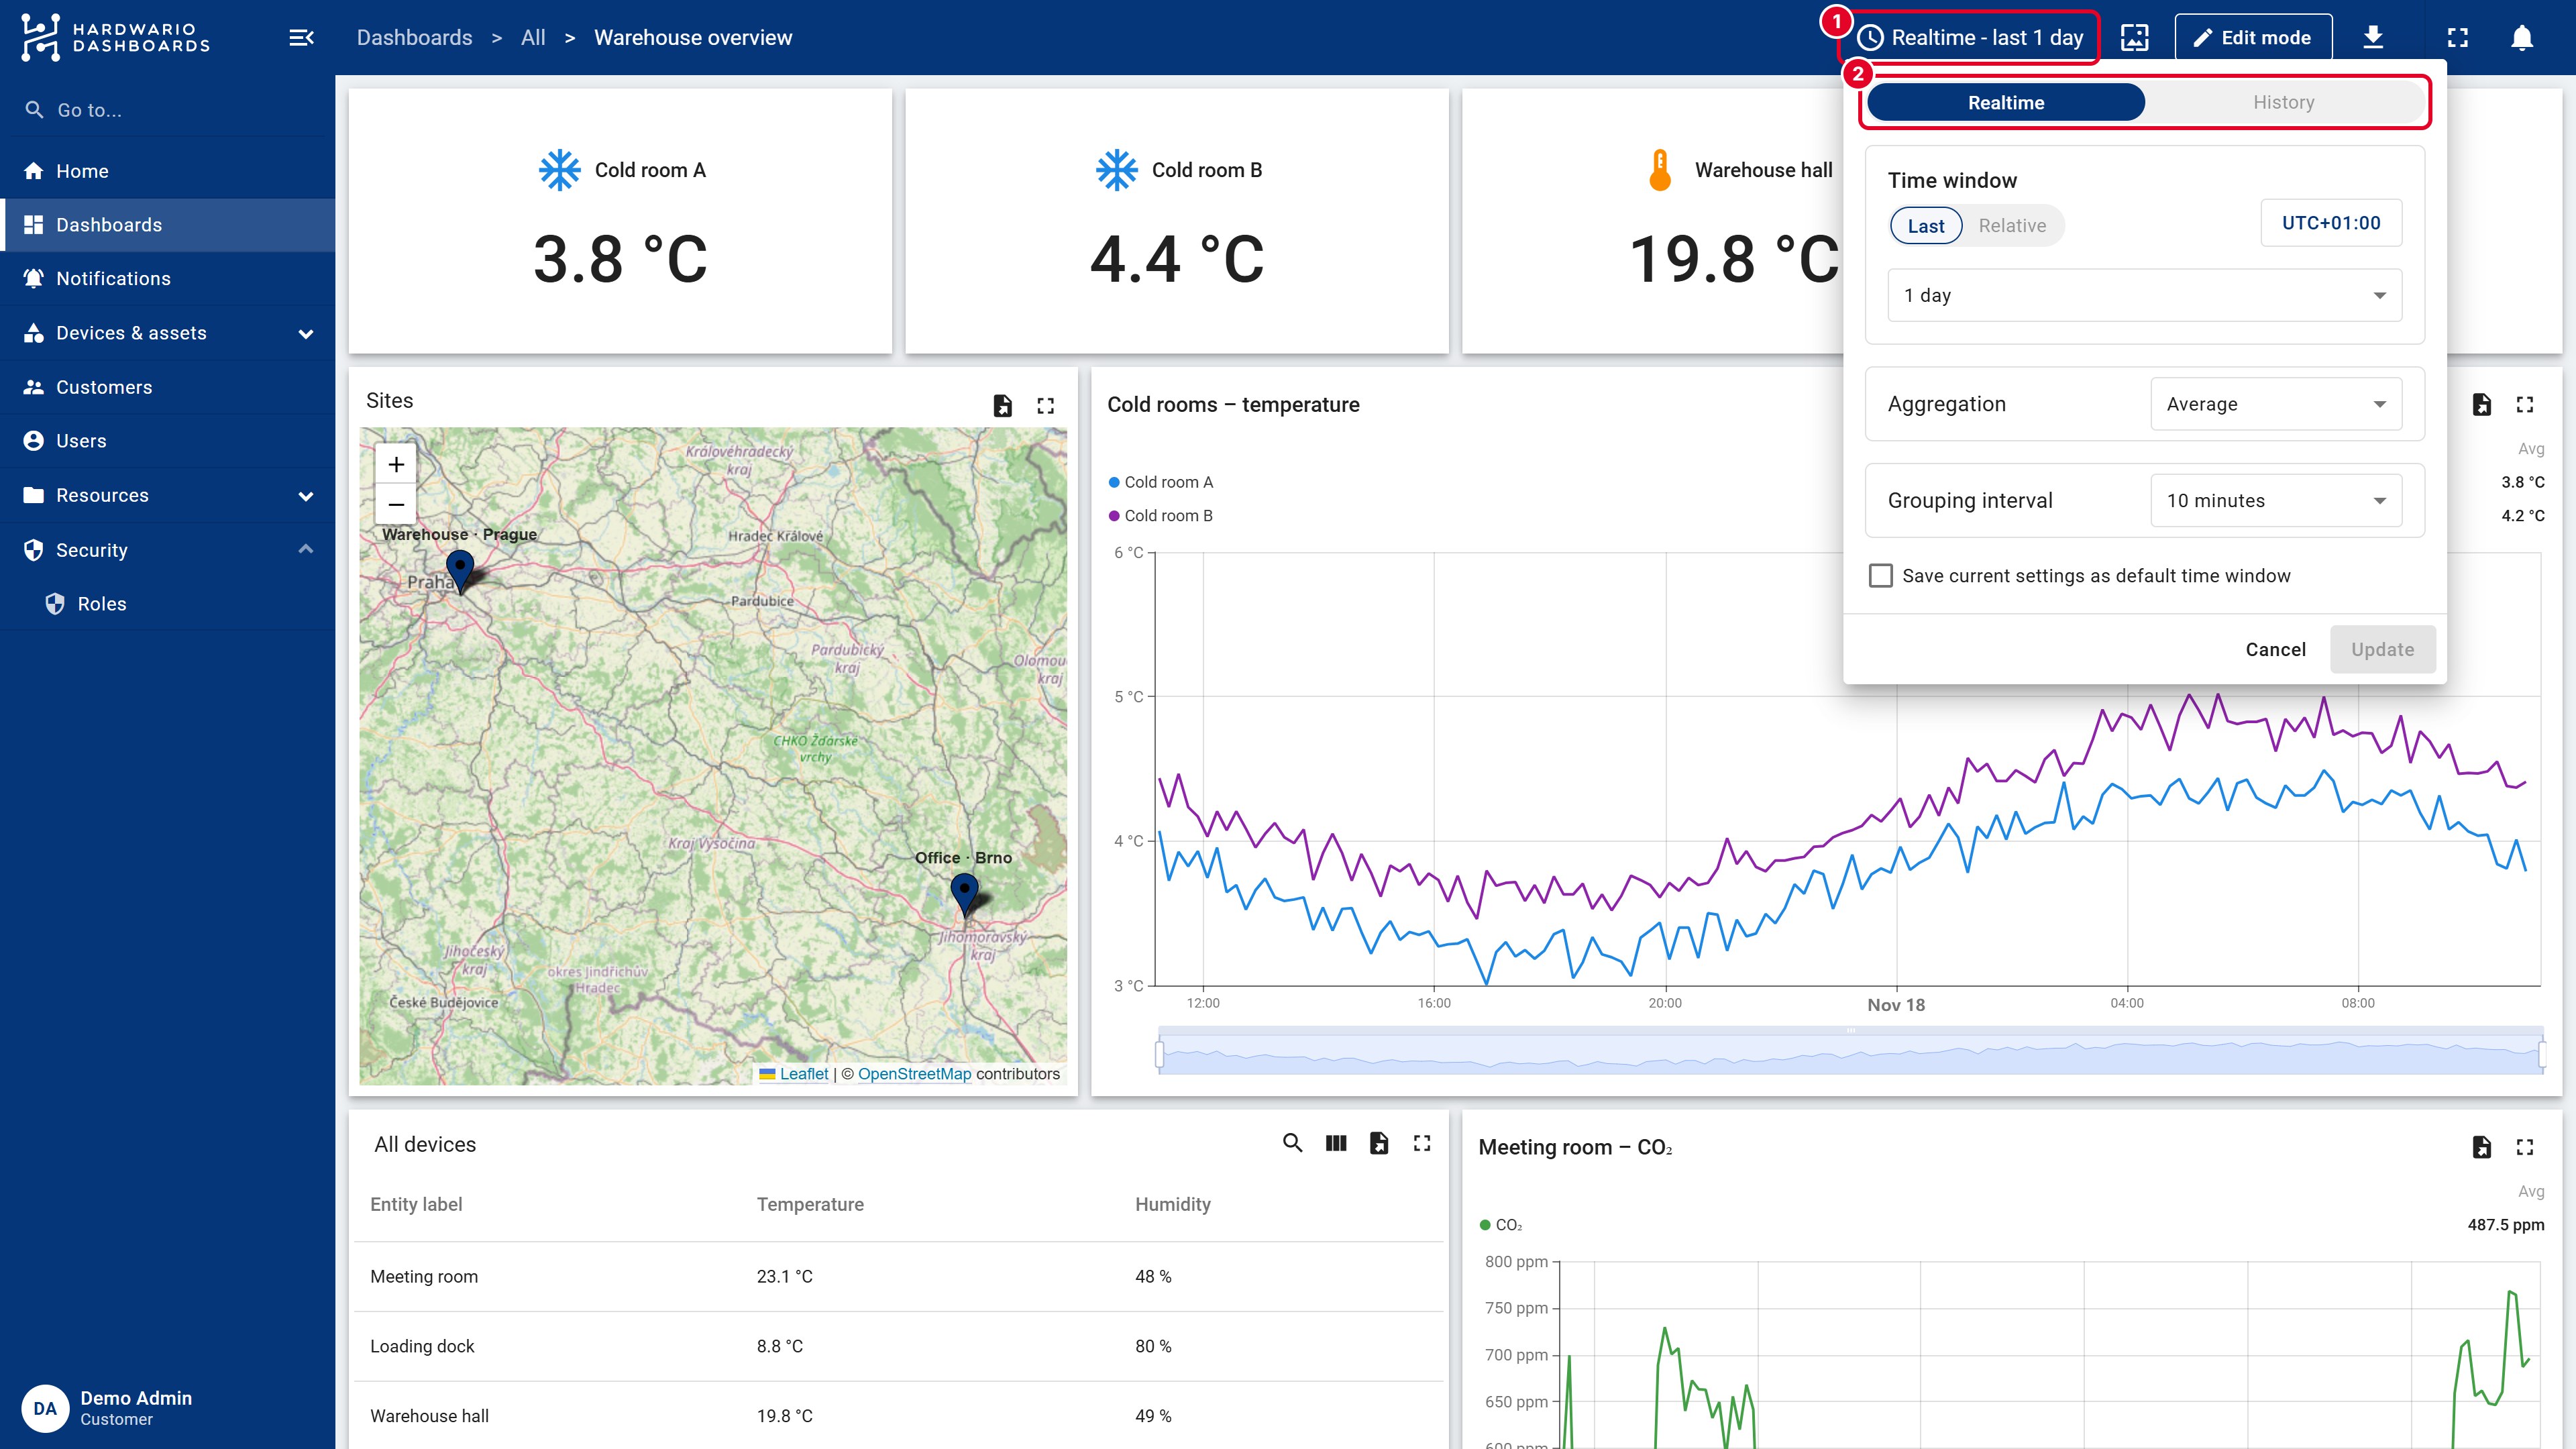
Aggregation
For long periods, a chart with every single value is hard to read and slow to load. Aggregation joins the values into intervals:
| Aggregation | Each interval shows |
|---|---|
| Average | the average value (the most common choice) |
| Min, Max | the lowest or highest value, for example the peak temperature |
| Sum, Count | the total or the number of values, for example for counters |
| None | every value as it was measured |
Grouping interval sets the length of one interval, for example 1 hour for a week, 1 day for a year.
Save the default time window
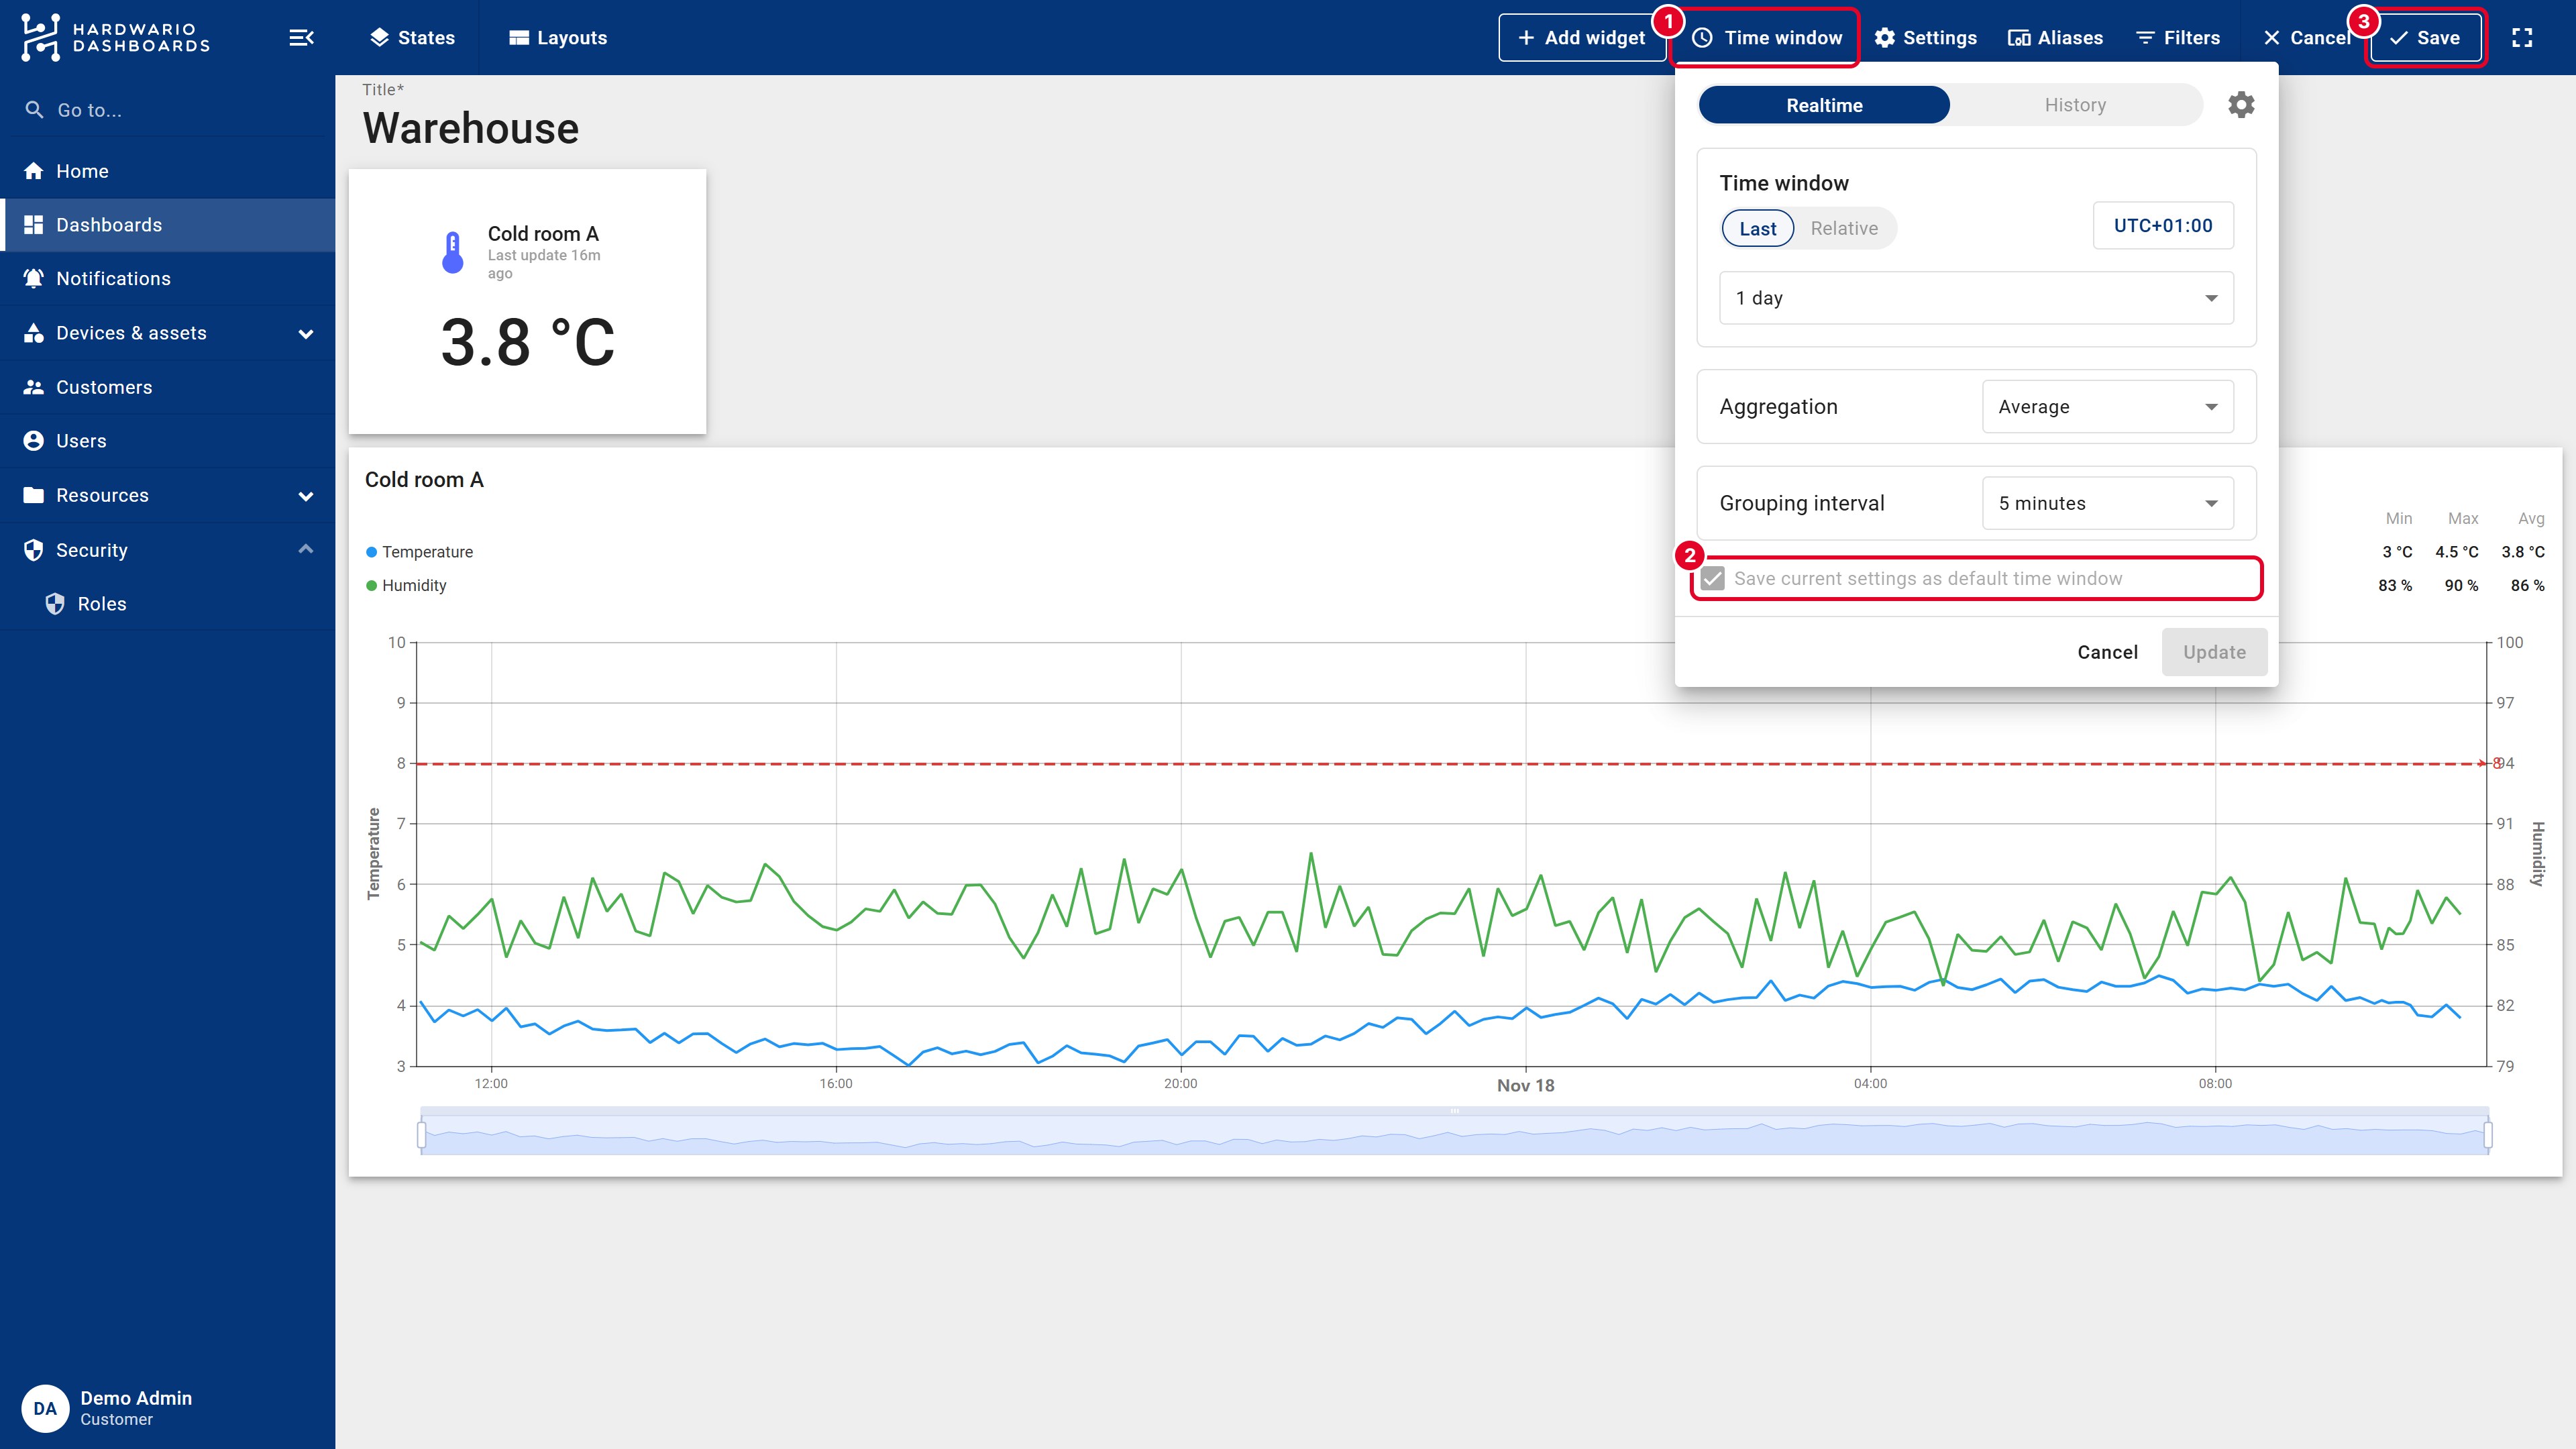
What you set in the time window while viewing a dashboard is only temporary: the next time you open the dashboard, it's back to the default. To change the default for everyone who opens the dashboard, including people with a public link:
- Click Edit mode in the top bar.
- Click Time window in the edit toolbar and set the period and aggregation. Save current settings as default time window is turned on.
- Click Update, then Save the dashboard.
A different time window for one widget
Sometimes one chart should show a different period, for example a weekly overview next to today's detail.
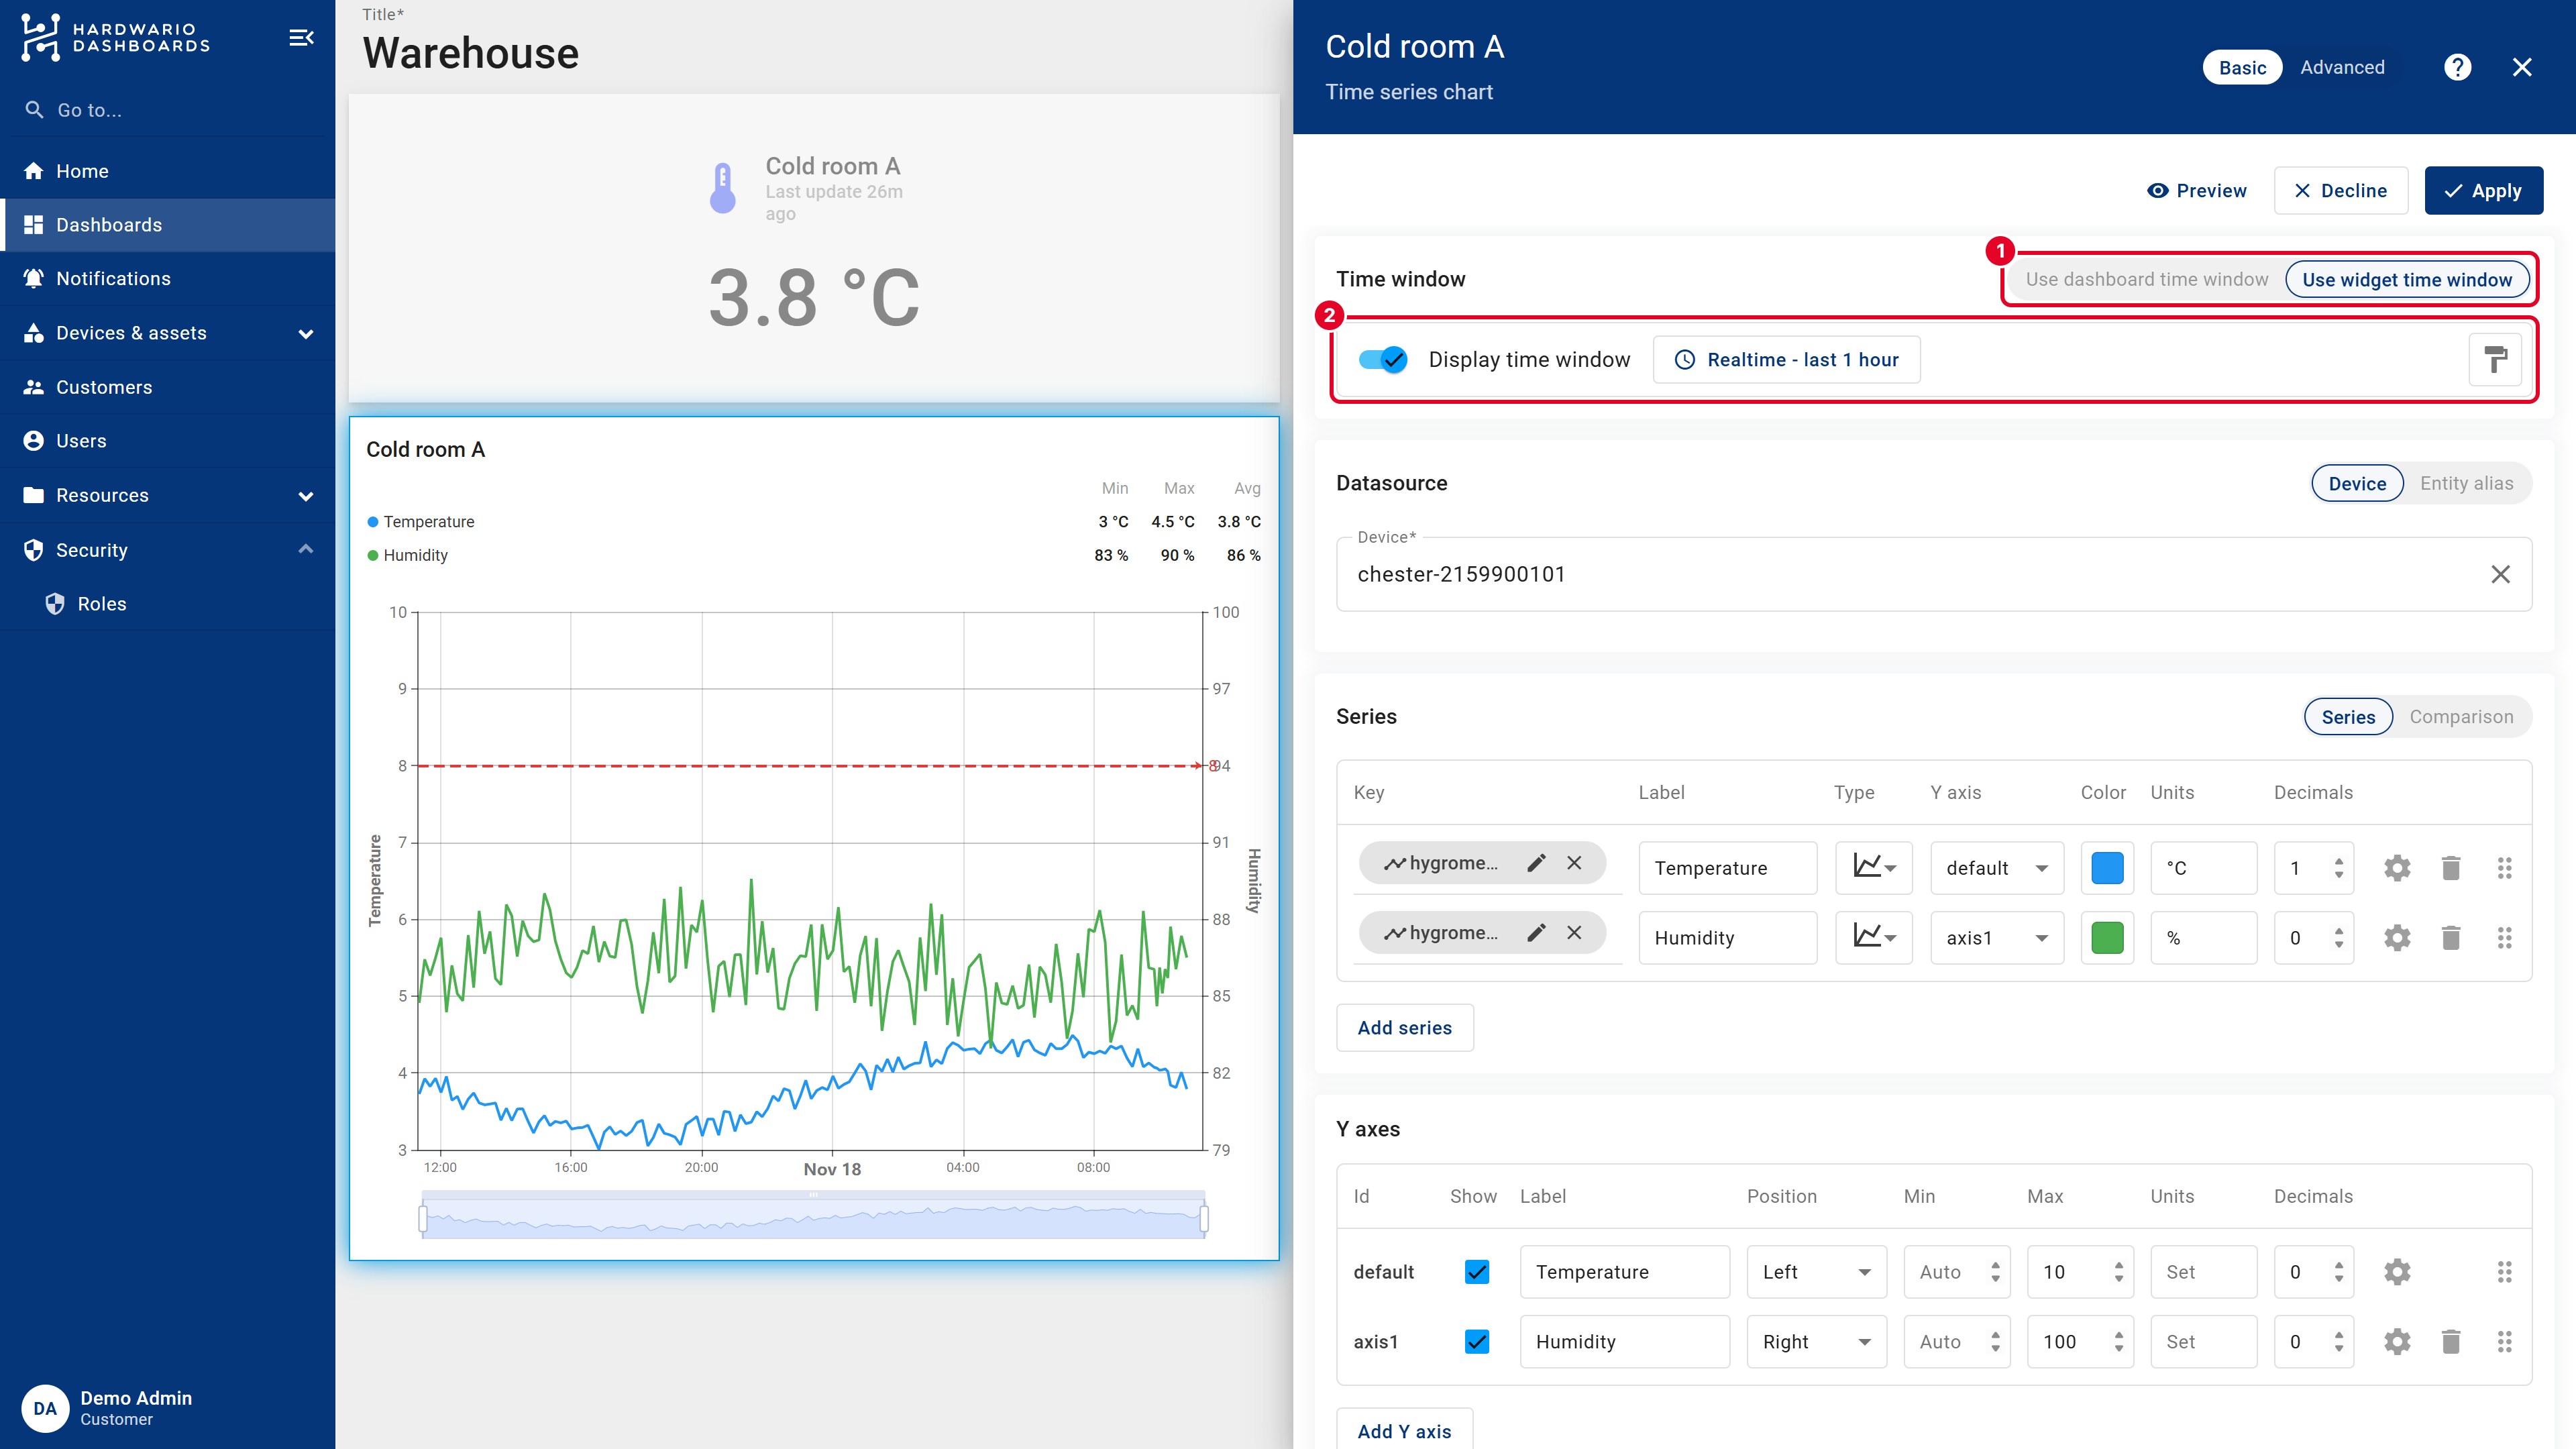
- In Edit mode, point at the widget and click its pencil icon.
- Under Time window, switch from Use dashboard time window to Use widget time window.
- Set the widget's own period. With Display time window on, viewers can change it right in the widget.
- Click Apply, then Save the dashboard.
This widget then keeps its own period when you change the time window of the dashboard.
Next steps
- Public link: share the dashboard, with the default time window you saved.
- Charts & styling: fine-tune your charts.
HARDWARIO Dashboards is built on ThingsBoard. More details in the official ThingsBoard documentation: Dashboard time window.