Charts & styling
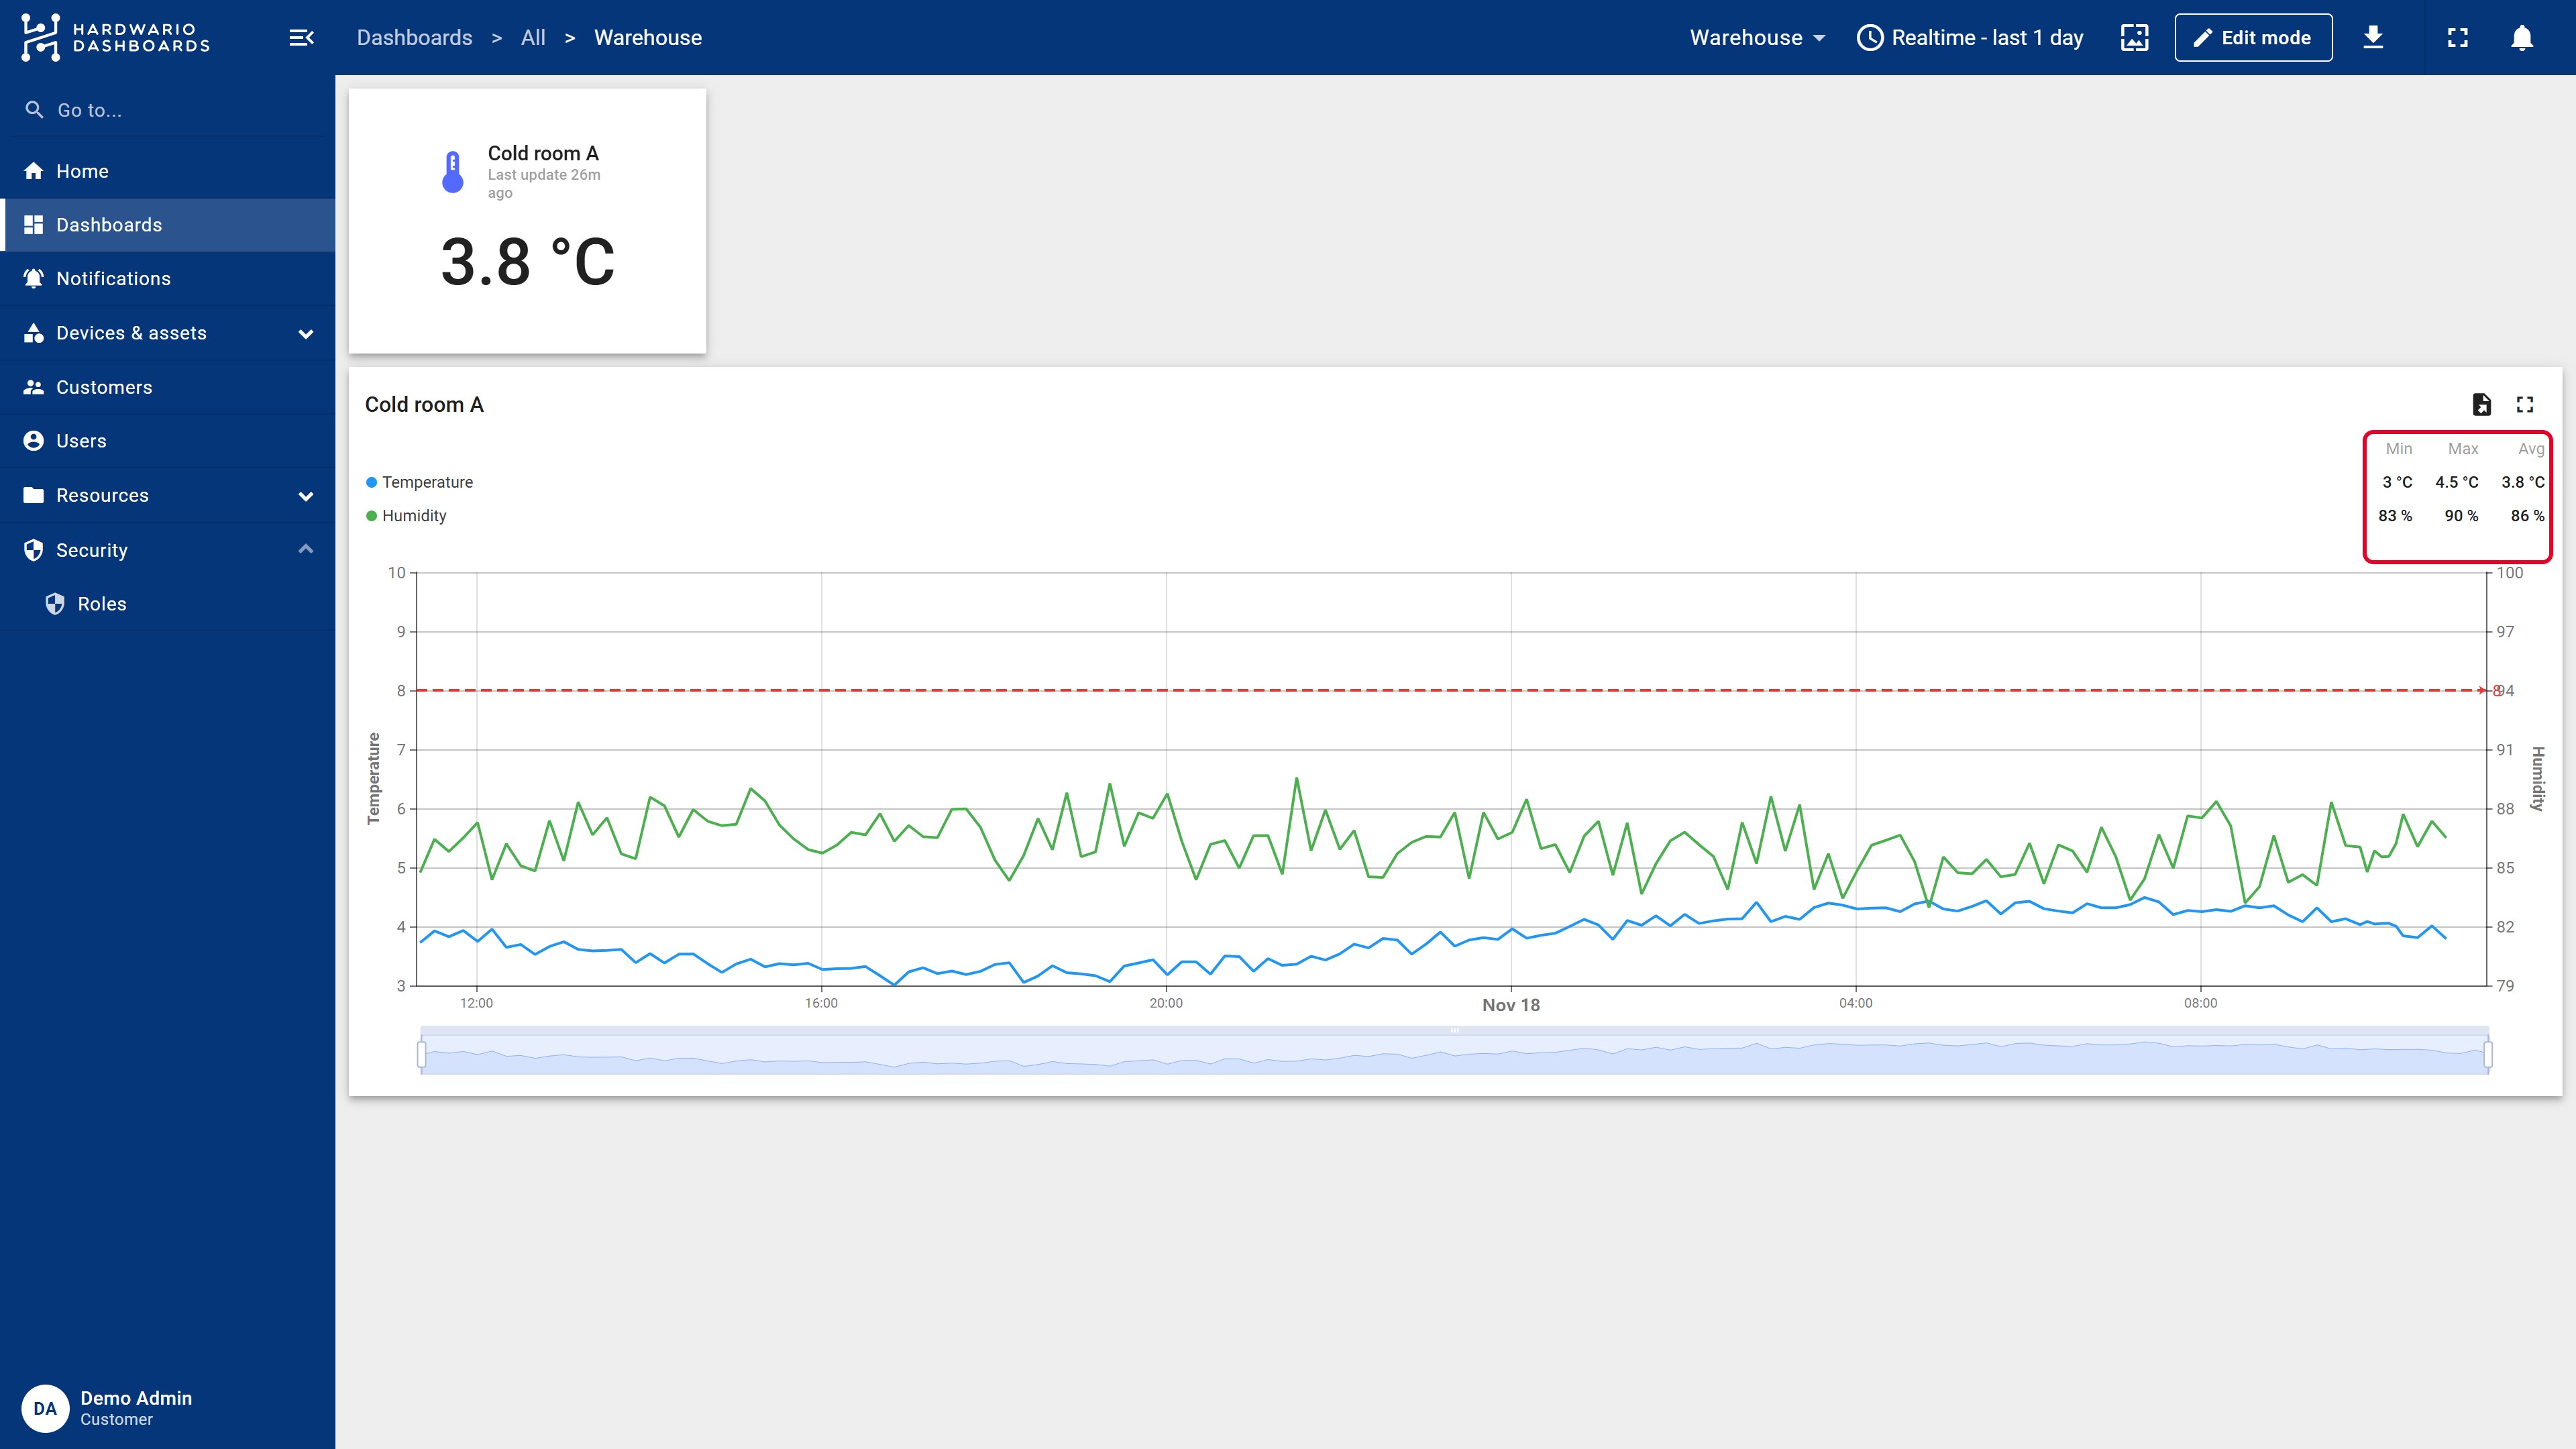
A chart shows how values change over time. In this guide, you'll add a Time series chart with temperature and humidity, put humidity on a second axis, draw a limit line and set up the legend.
The result looks like this:
You need a dashboard to put the chart on. See Your first dashboard if you don't have one yet.
Step 1: Add the chart
- Open the dashboard and click Edit mode in the top bar.
- Click Add widget and choose the Charts bundle.
- Choose Time series chart.
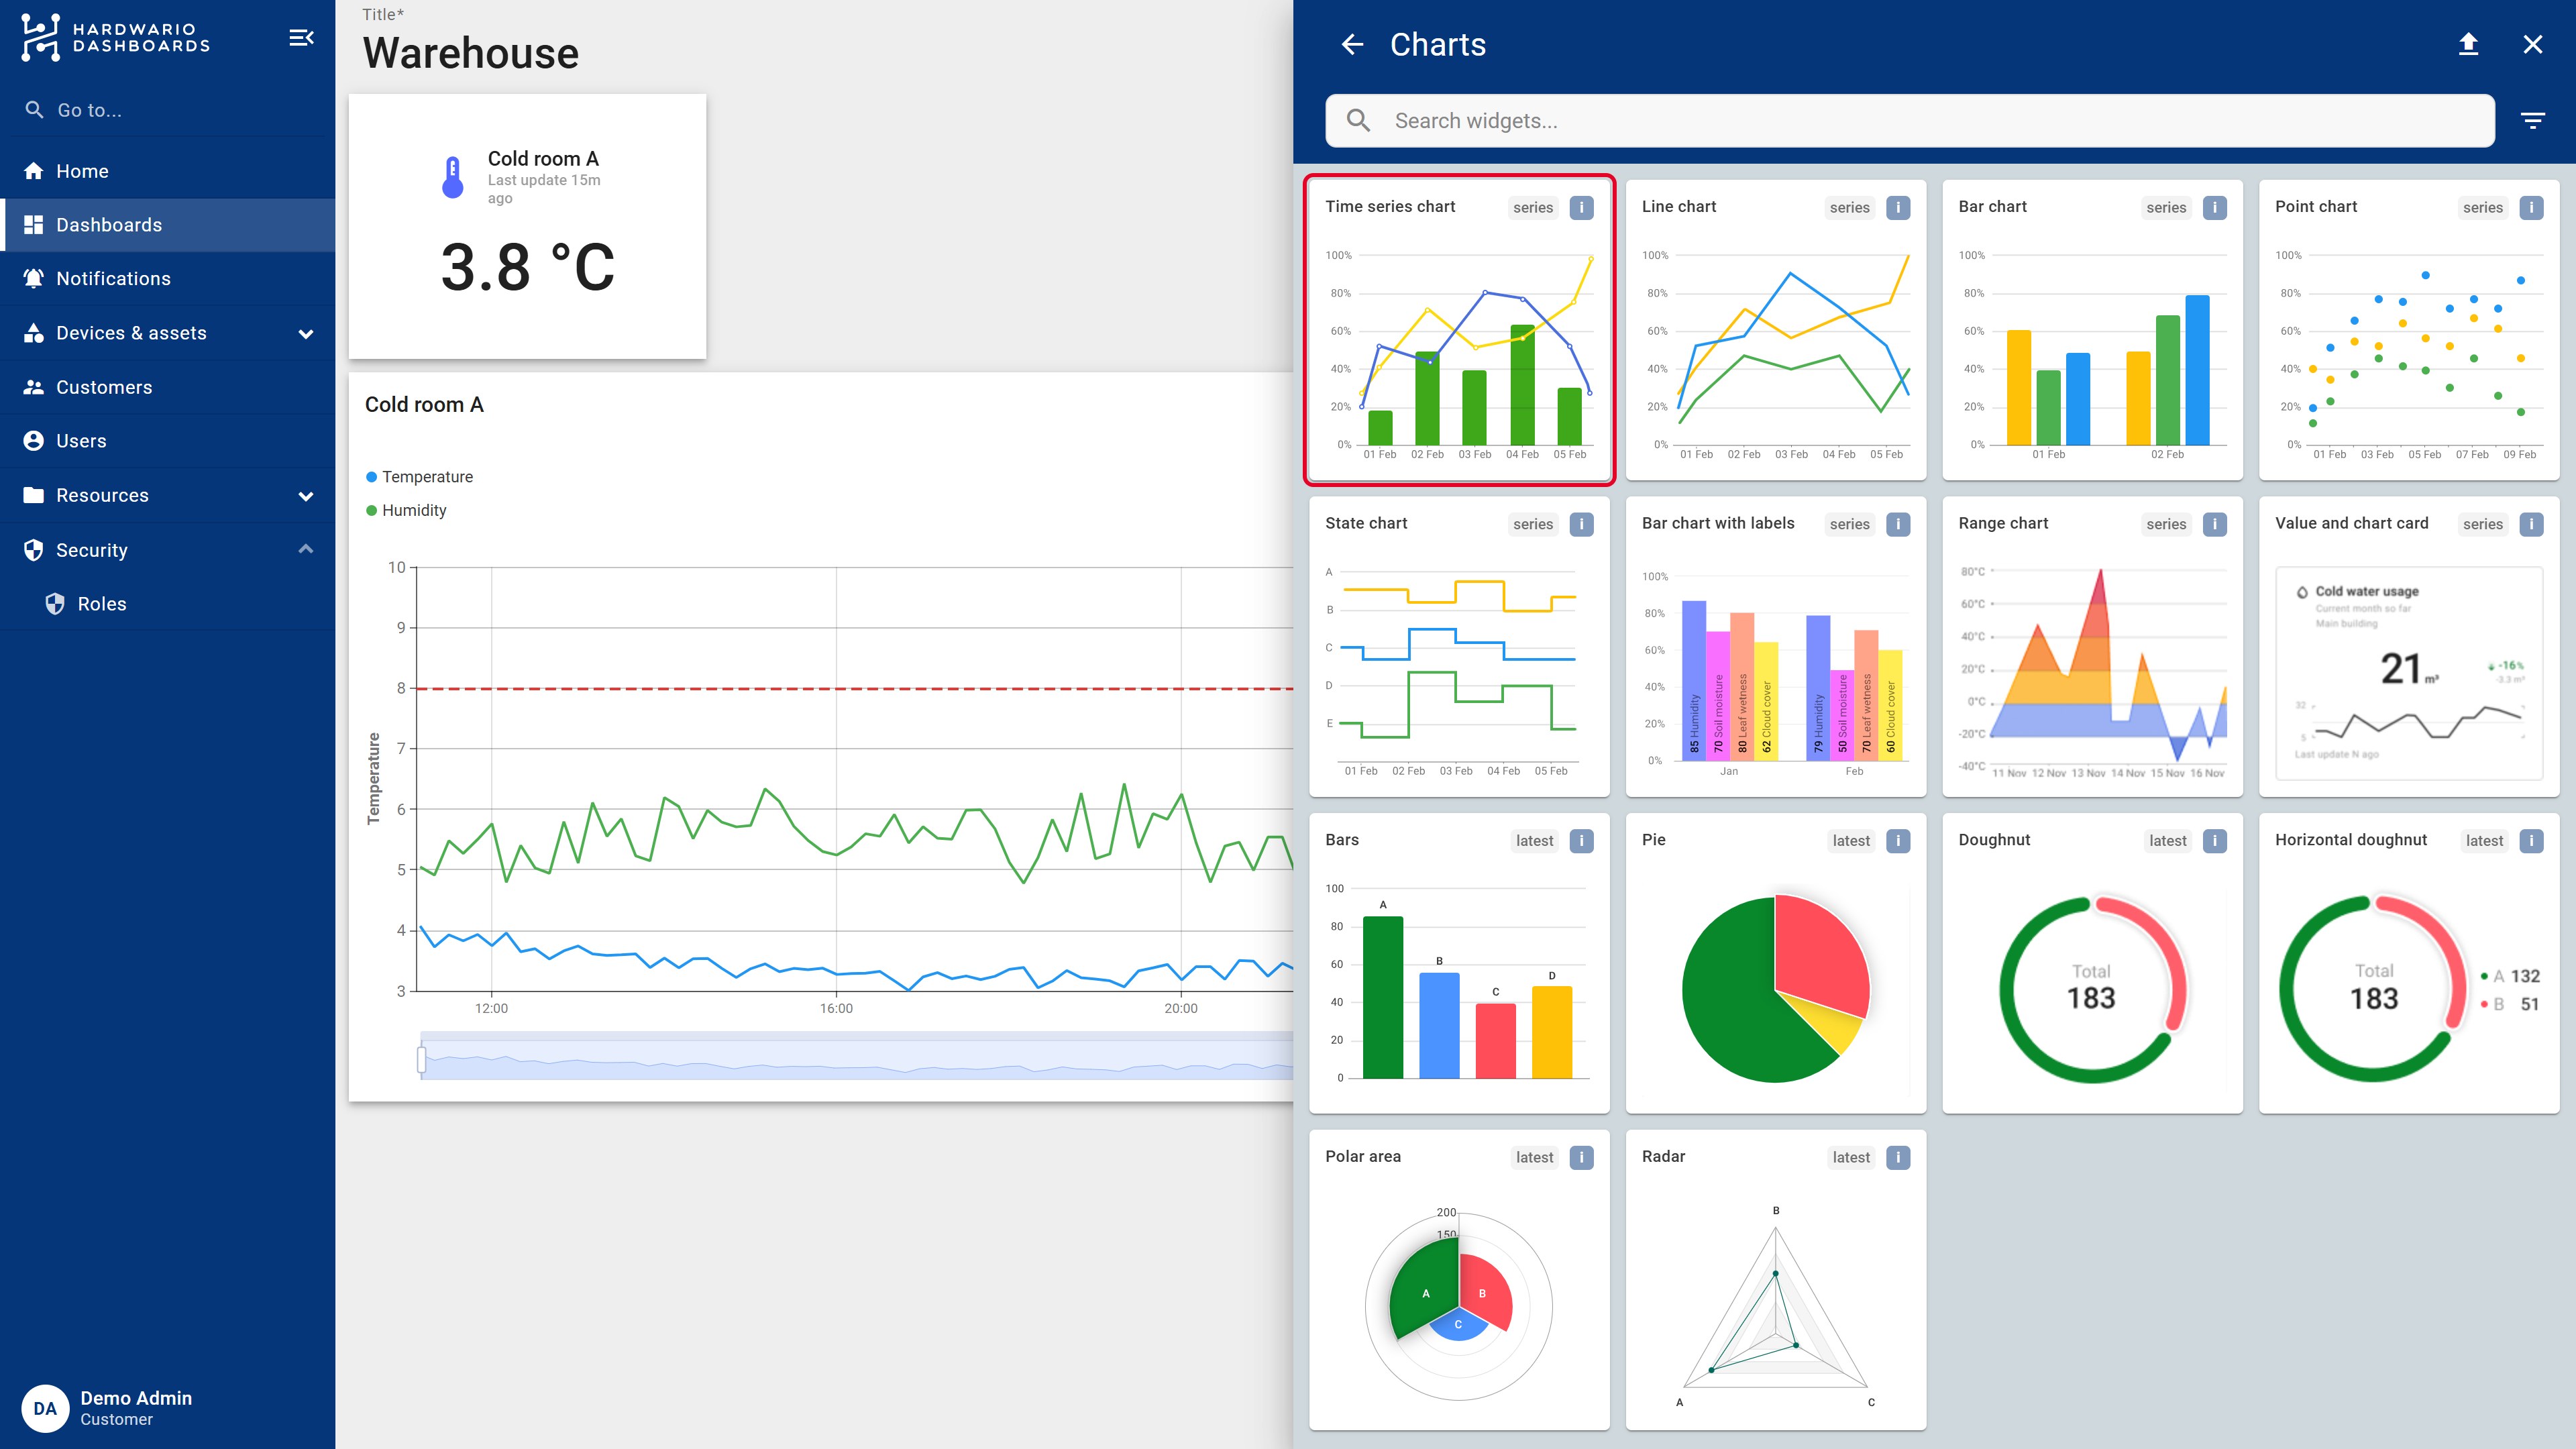
Time series chart is the most flexible: it can show lines, bars and points, several axes and limit lines. Line chart, Bar chart and Point chart are simpler variants with a preset look.
Step 2: Choose the device and the values
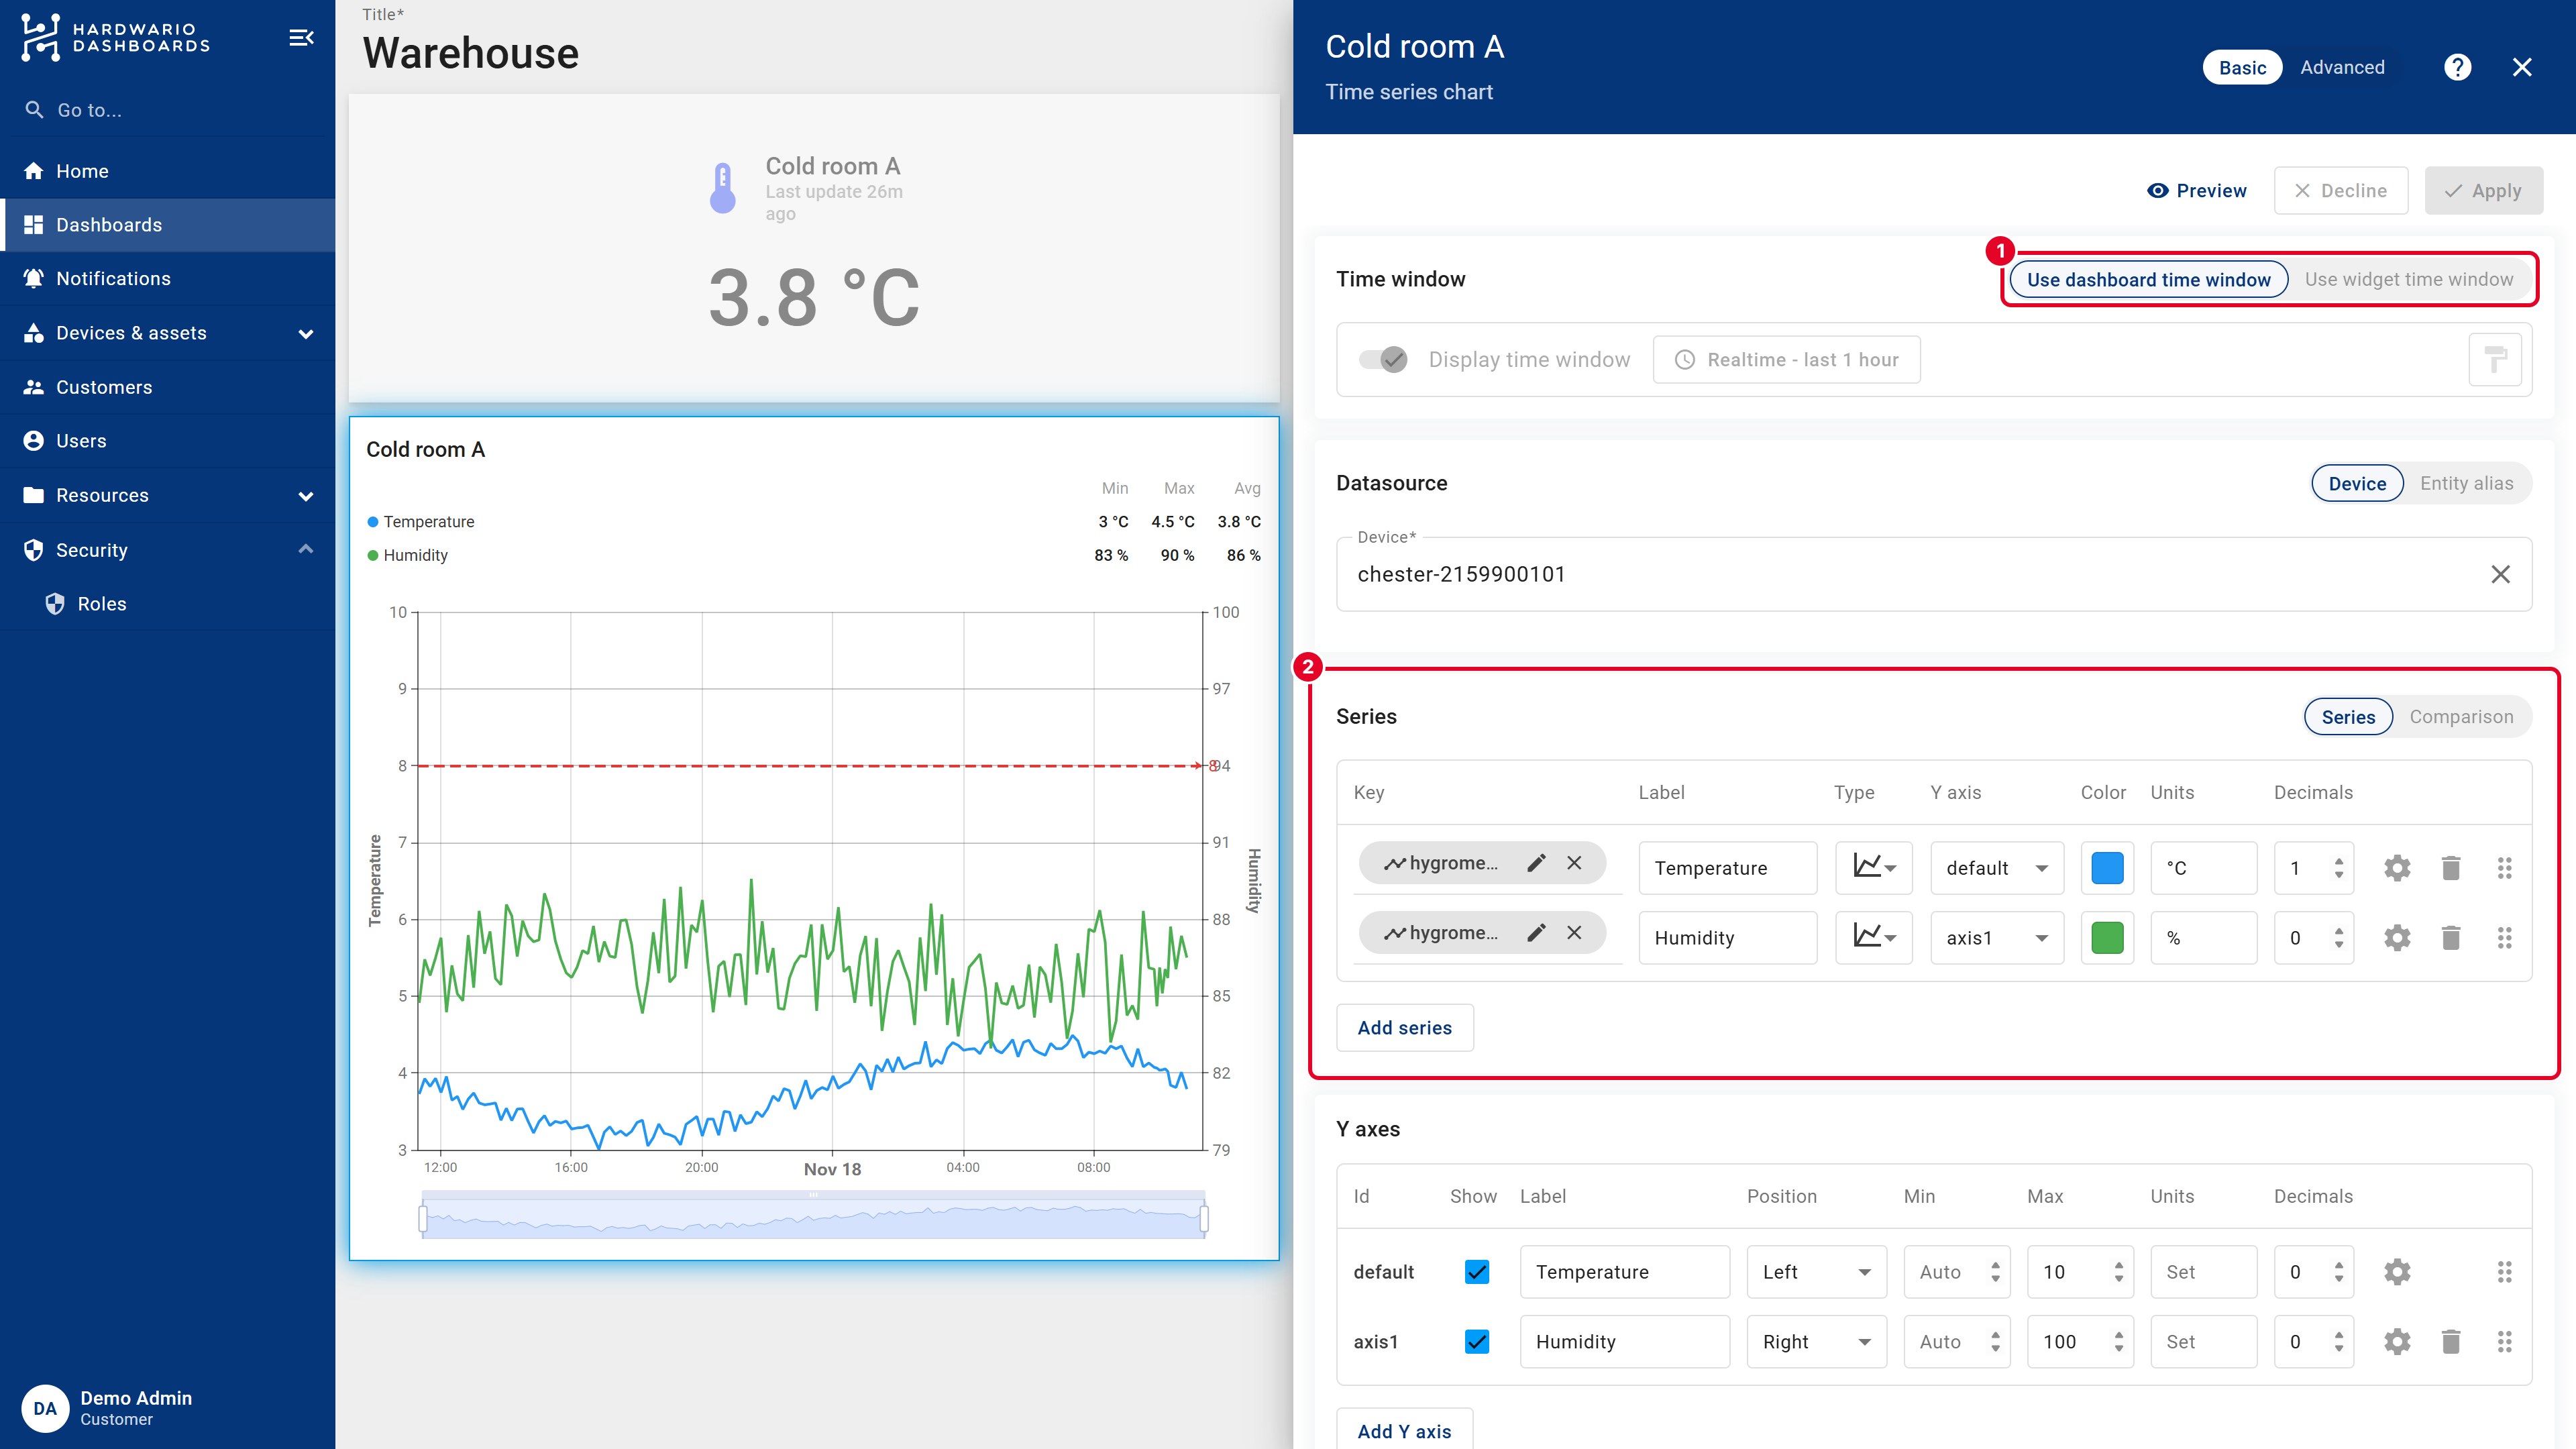
- Under Datasource, pick your Device.
- Under Series, remove the default key and pick the first value, for example
hygrometer.temperature.measurements.avg. - Set a clear Label (Temperature), the Units (
°C) and the number of Decimals. Click the color square to change the color. - To show more values in one chart, click Add series and pick another key, for example humidity. Give it its own label, unit (
%) and color.
Each series has more settings under its gear icon: line or bars, smooth or straight line, line width, points and a filled area under the line. The Type column switches between a line, bars and points.
Step 3: Add a second Y axis
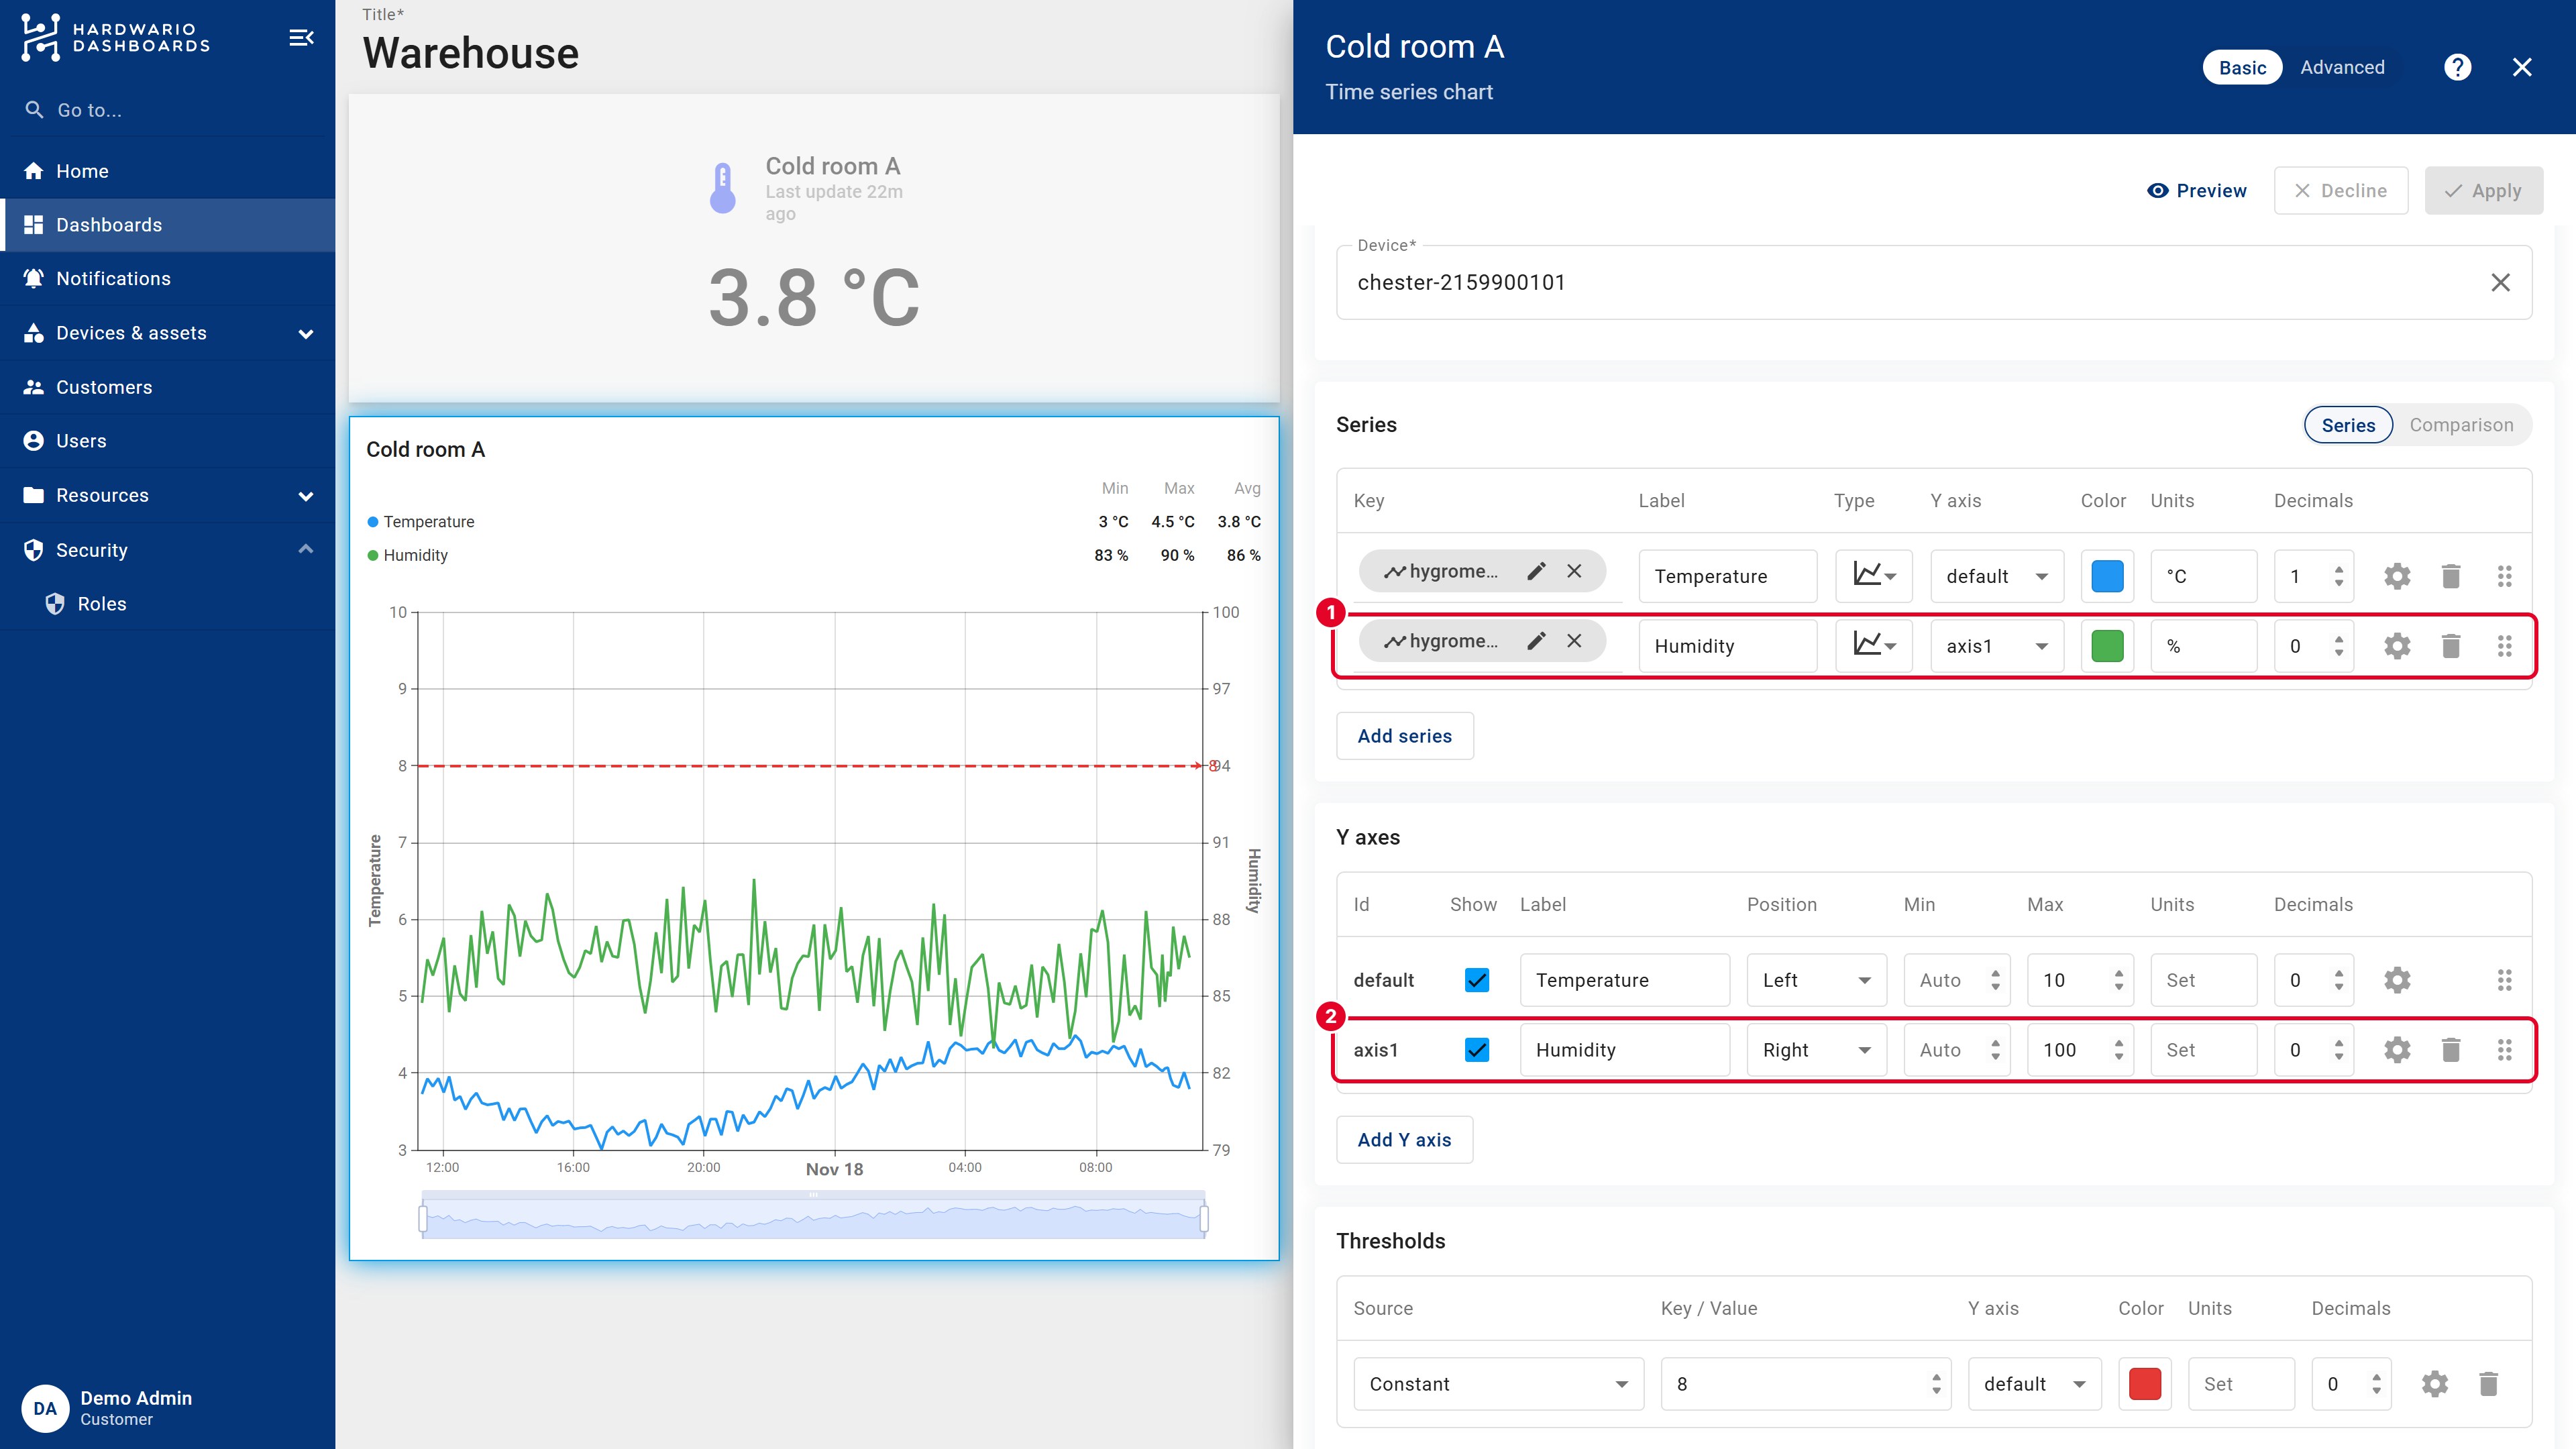
Temperature is in degrees, humidity in percent. On a single axis, one of them would be a flat line. Give each its own axis:
- Under Y axes, click Add Y axis. A new axis
axis1appears. - Set its Position to Right and its Label, for example Humidity.
- Give the default axis a Label too, for example Temperature.
- Back in Series, set the Y axis of the humidity series to
axis1.
Min and Max fix the range of an axis. With a fixed range, the chart doesn't jump up and down with every new value, and a limit line always stays in view.
Step 4: Draw a limit line
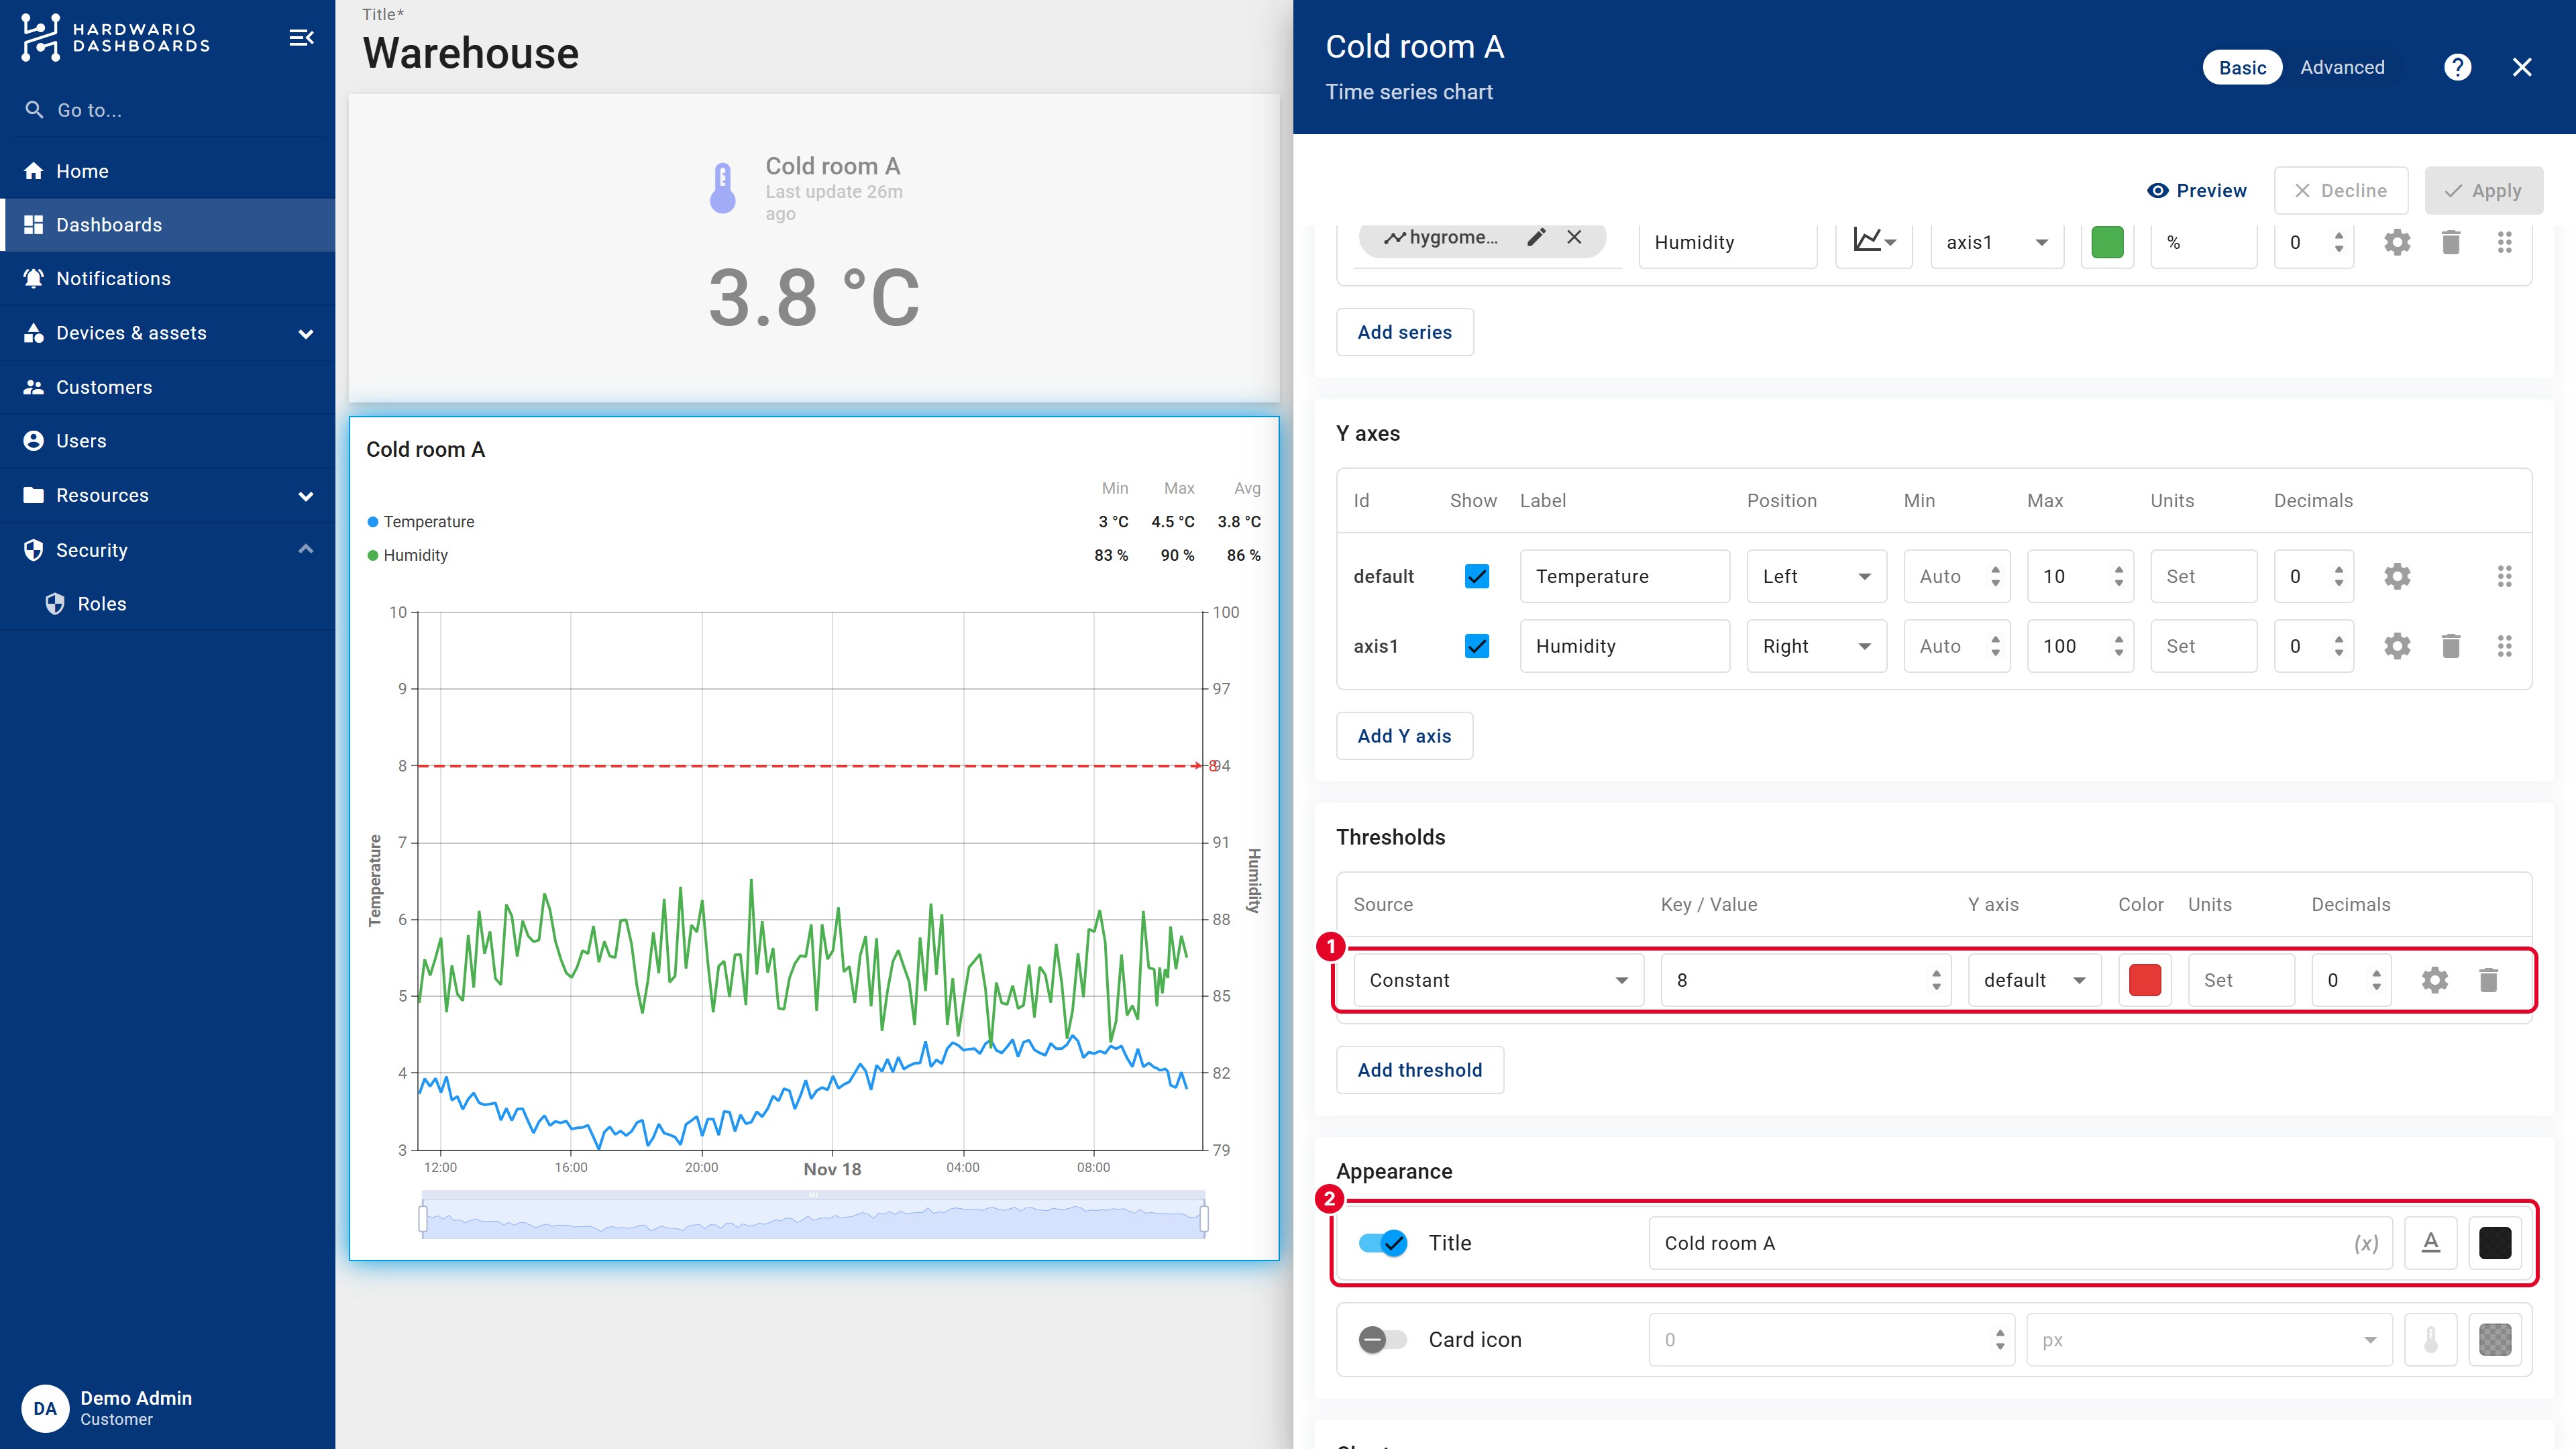
A threshold is a horizontal line that marks a limit, so anyone sees at a glance when a value is too high.
- Under Thresholds, click Add threshold.
- Keep Source on Constant and enter the Value, for example
8. - Choose the Y axis the value belongs to and a Color, for example red. The gear icon sets a dashed line and its width.
Step 5: Title, legend and tooltip
- Appearance → Title: the name shown above the chart, for example Cold room A. You can add a Card icon, too.
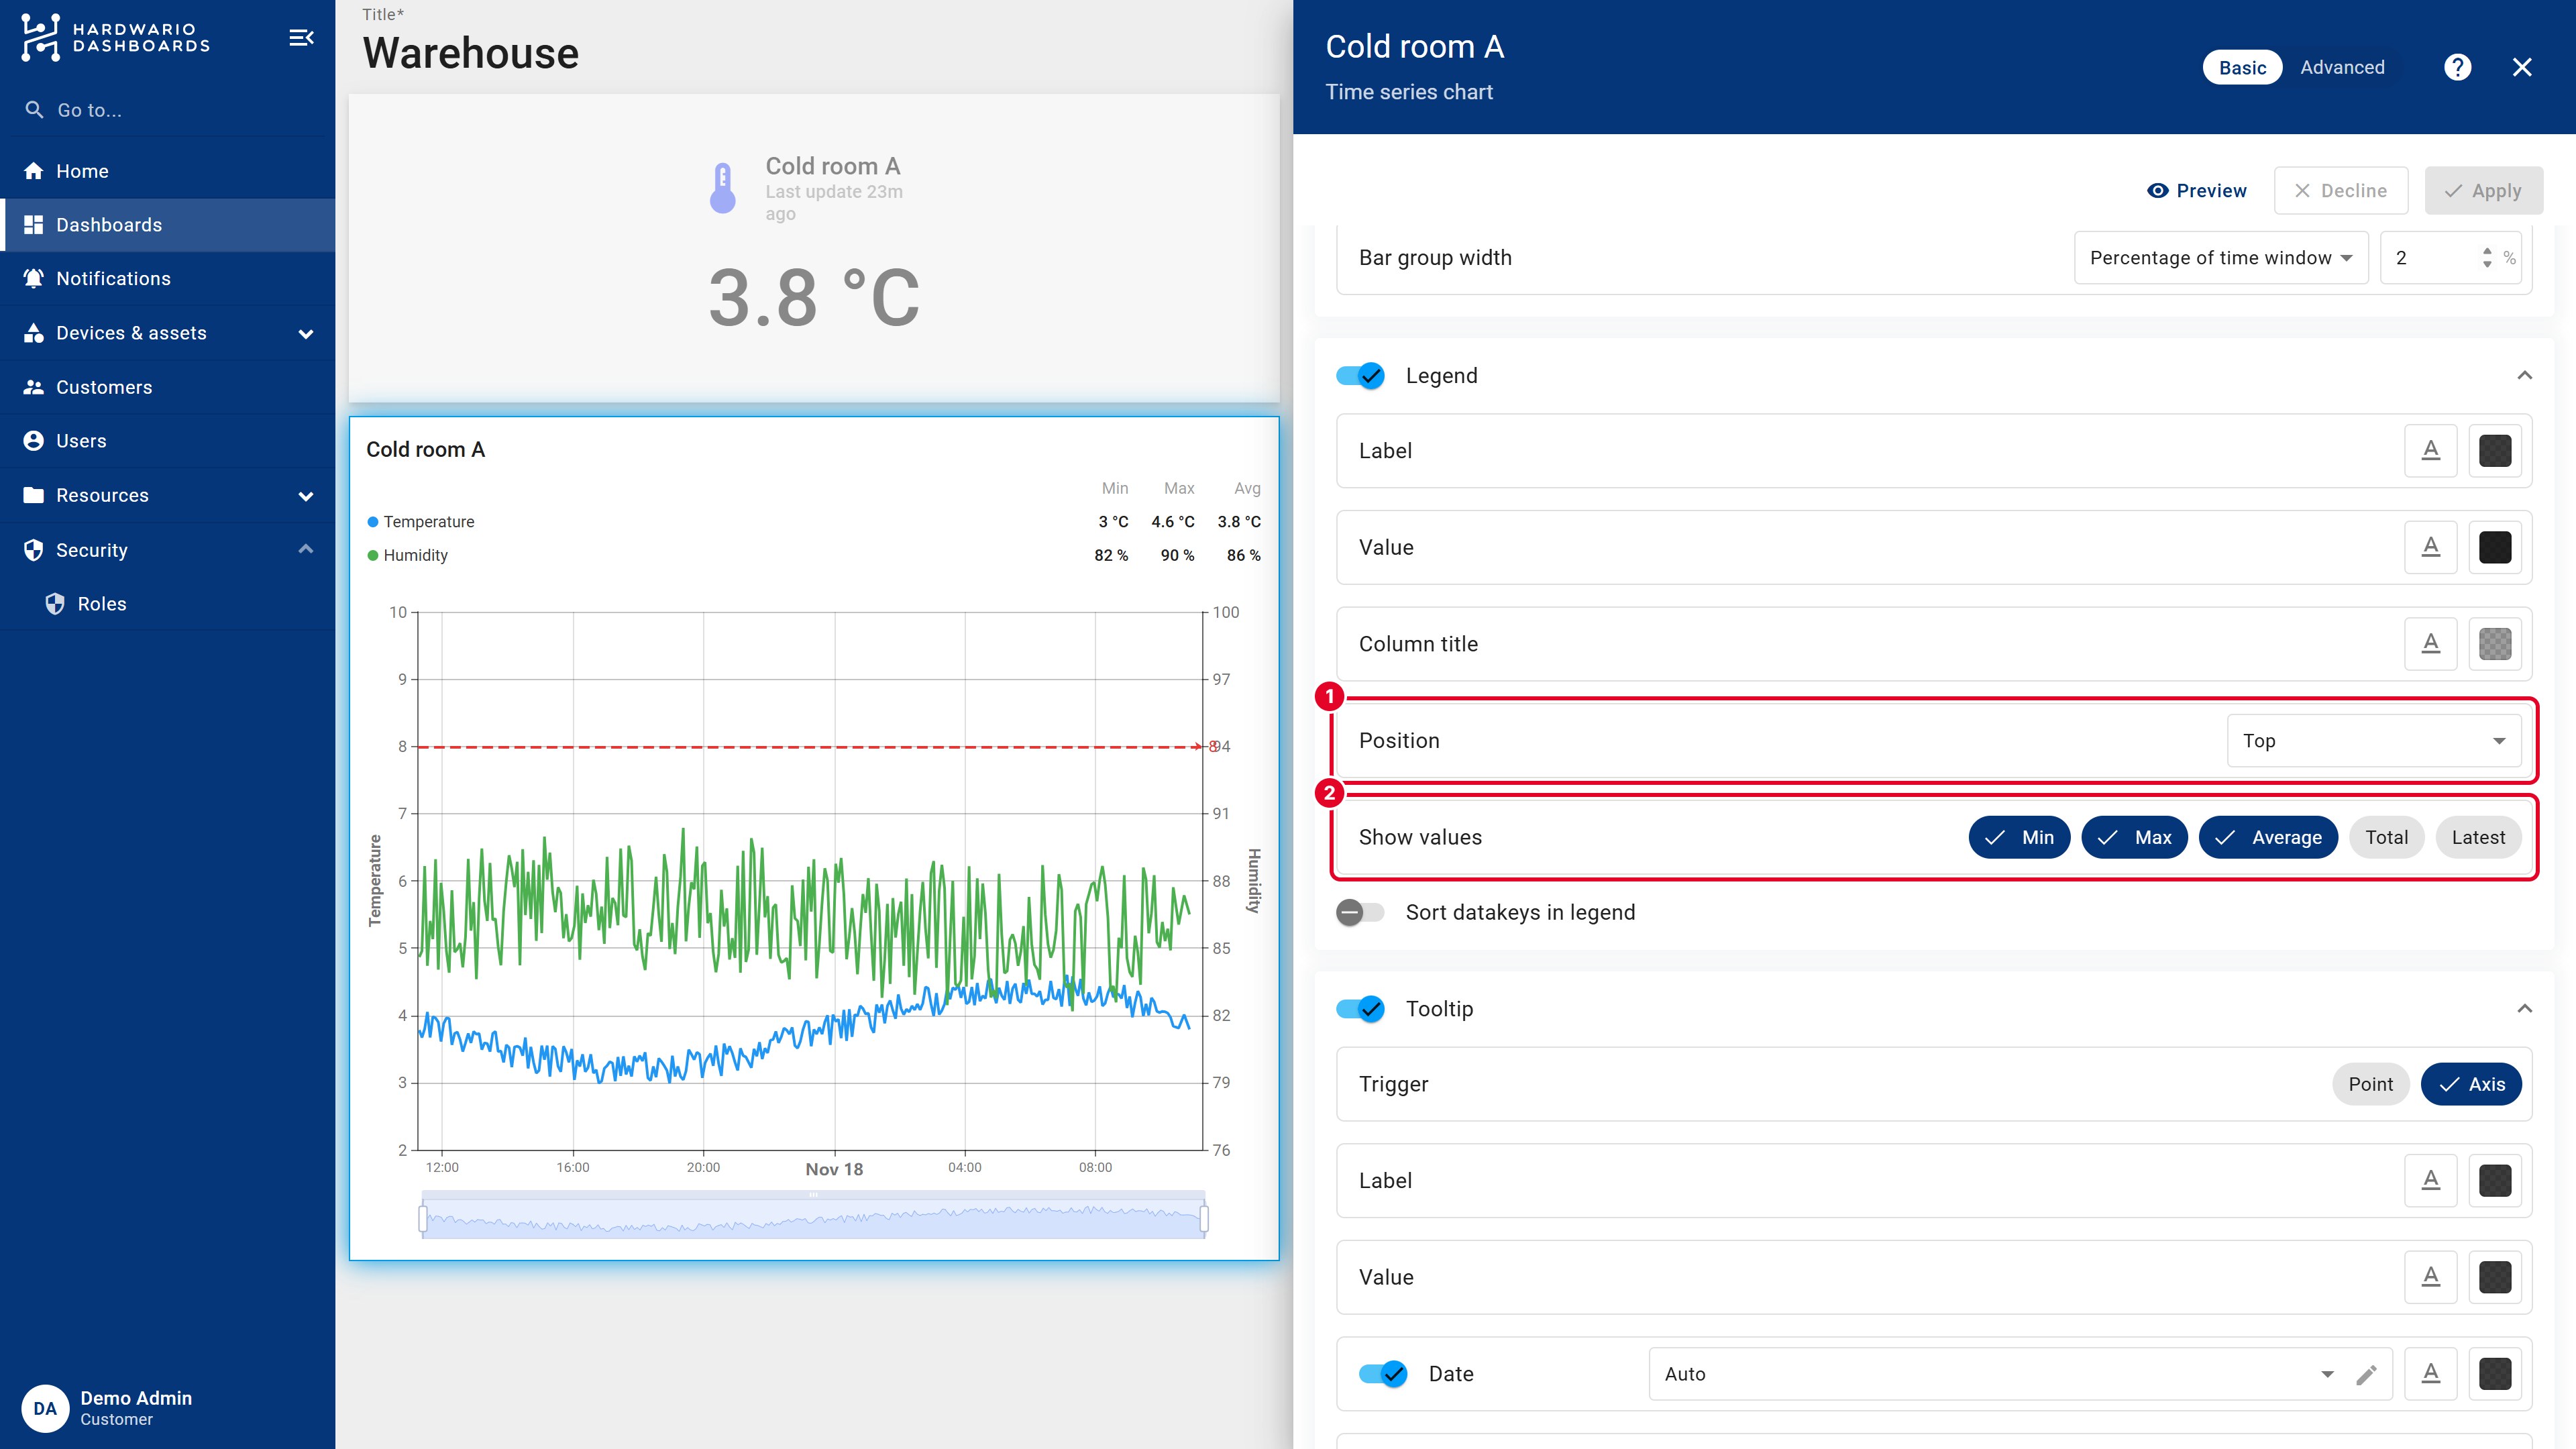
- Legend: choose its Position and which values it shows next to each series: Min, Max, Average, Total or Latest.
- Tooltip: what appears when you point at the chart. Axis shows all series at that moment, Point only the one under the mouse.
- Chart → Data zoom adds the slider under the chart for zooming in.
Click Add, then Save the dashboard.
Step 6: Work with the chart
- Point at the chart to see the exact values at that time.
- Drag the slider under the chart, or drag across the chart, to zoom in.
- Click a series in the legend to hide or show it.
- Use the download icon in the chart's corner to export its data, and the expand icon to show it full screen.
To change the chart later, switch to Edit mode, point at the chart and click its pencil icon. All settings are in one panel:
Usually the period is the problem: a new dashboard shows only the last hour. See Time window.
Next steps
- Time window: choose the period your charts show.
- Public link: share the dashboard.
HARDWARIO Dashboards is built on ThingsBoard. More details in the official ThingsBoard documentation: Time series chart.