Displaying the Current Value of a Variable (Metric)
This widget allows you to display a single numerical value — such as temperature, humidity, or any sensor reading — in a clear and simple format. It’s ideal for showing the latest or average reading at a glance.
Step-by-Step Instructions
-
Open Dashboards
In the top navigation bar, click on
Data, then selectDashboards. This will open the dashboard management area.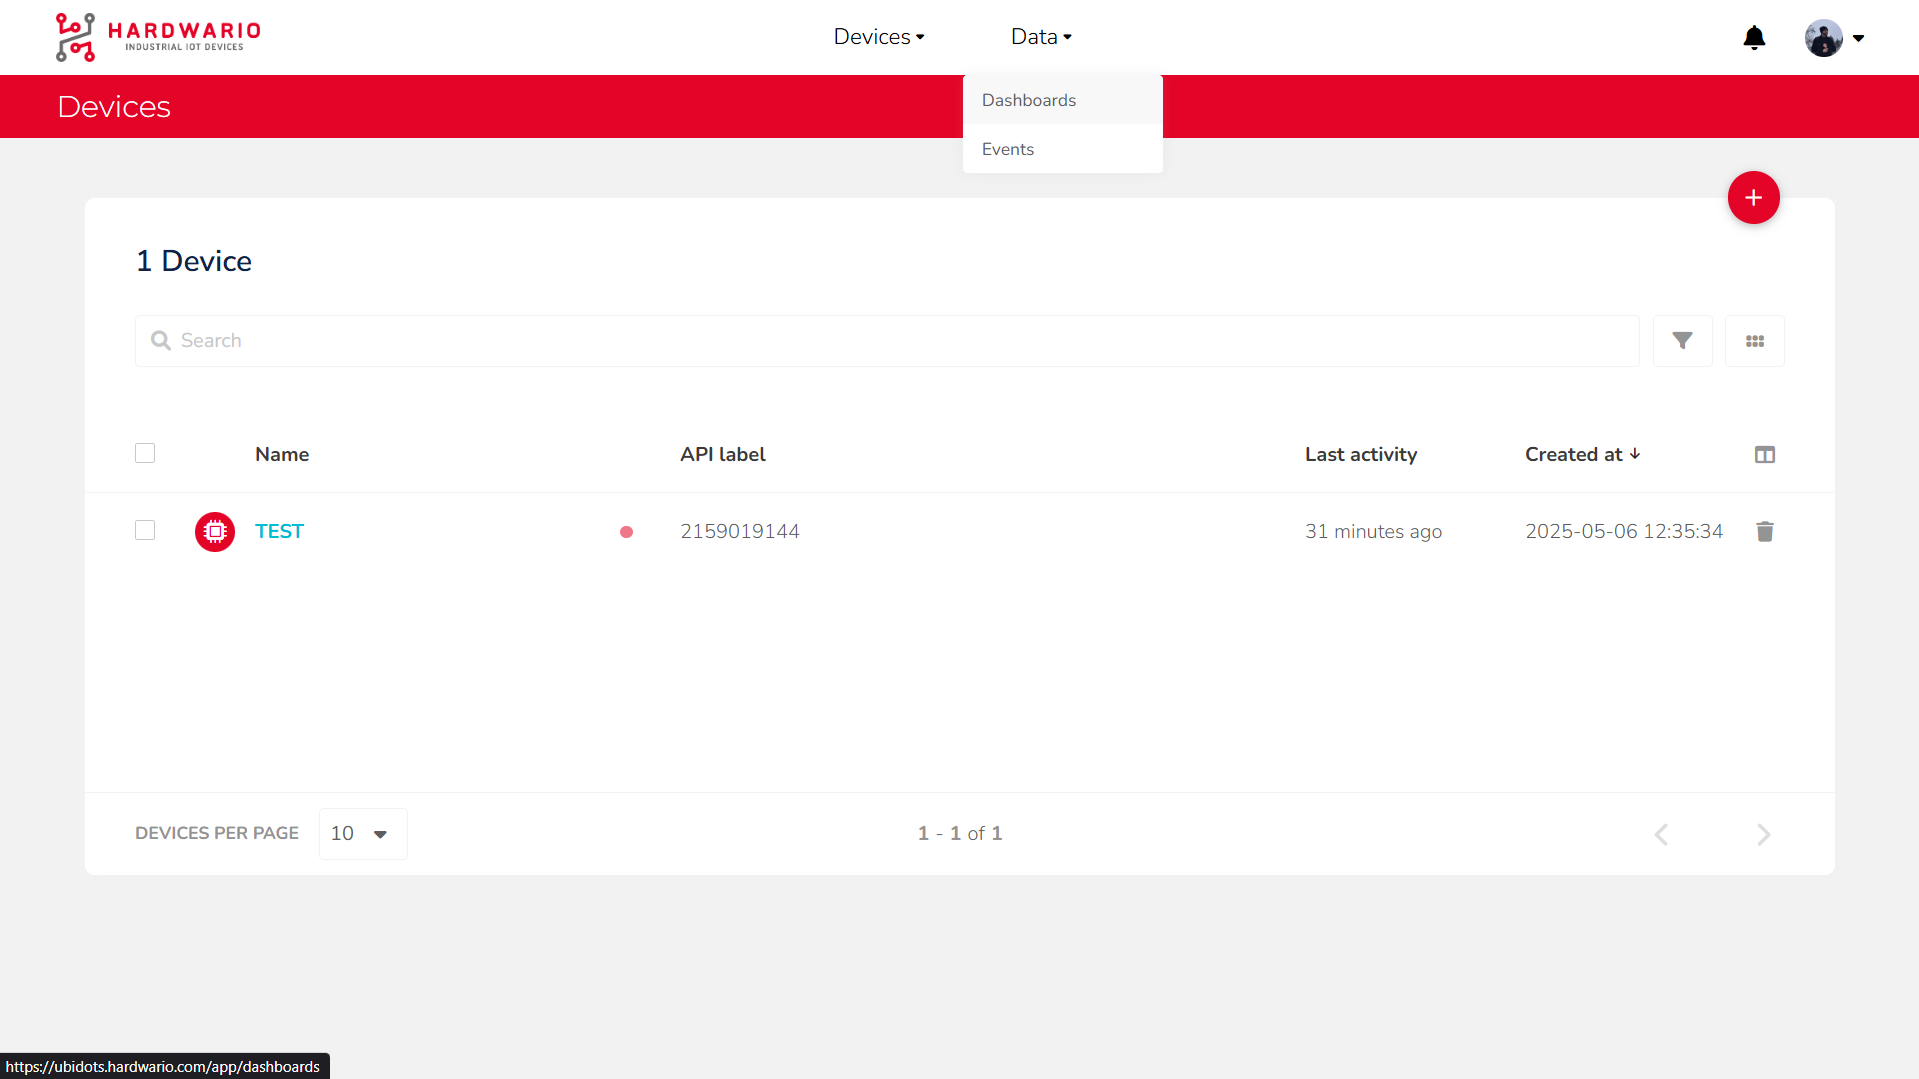
-
Add a New Widget
Click the
Add new Widgetbutton (marked with a + icon).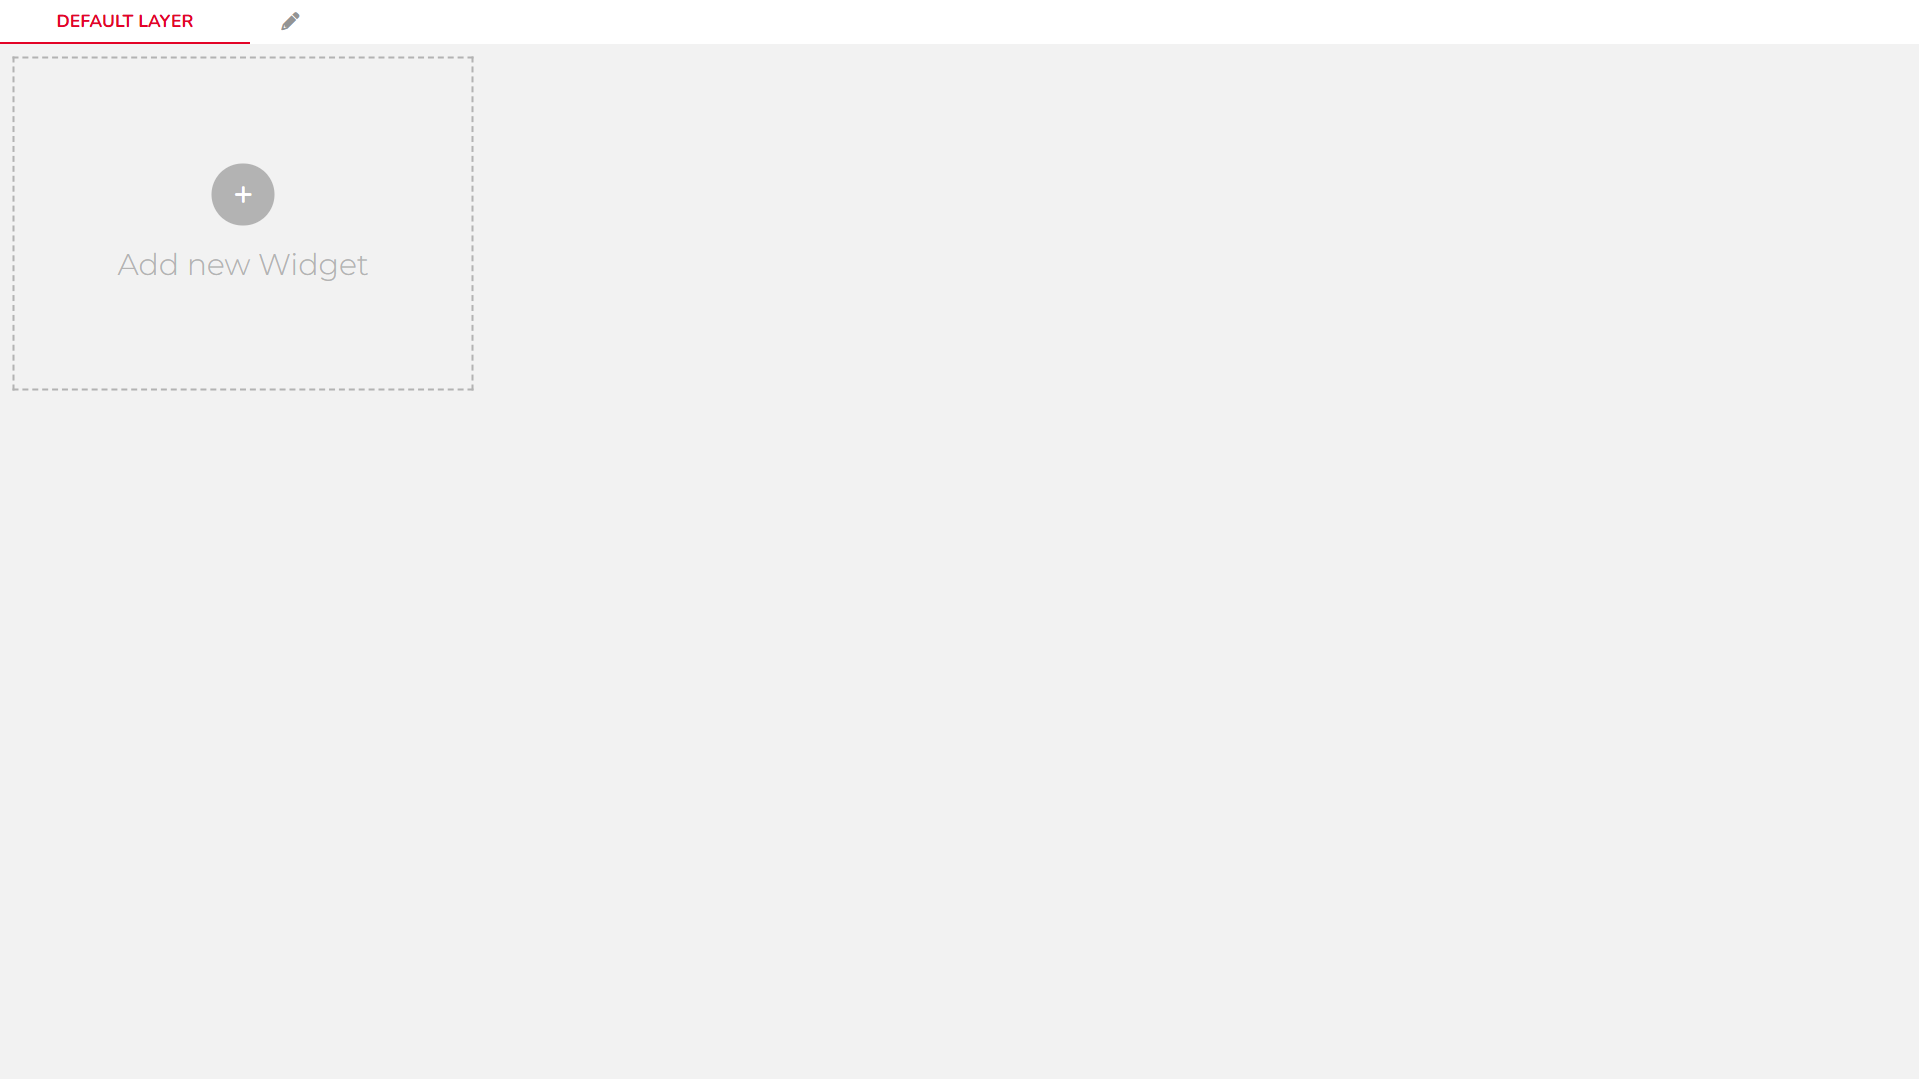
-
Choose a Widget Type
From the list of available widgets, choose one of the
Metrictypes (used to display numerical values).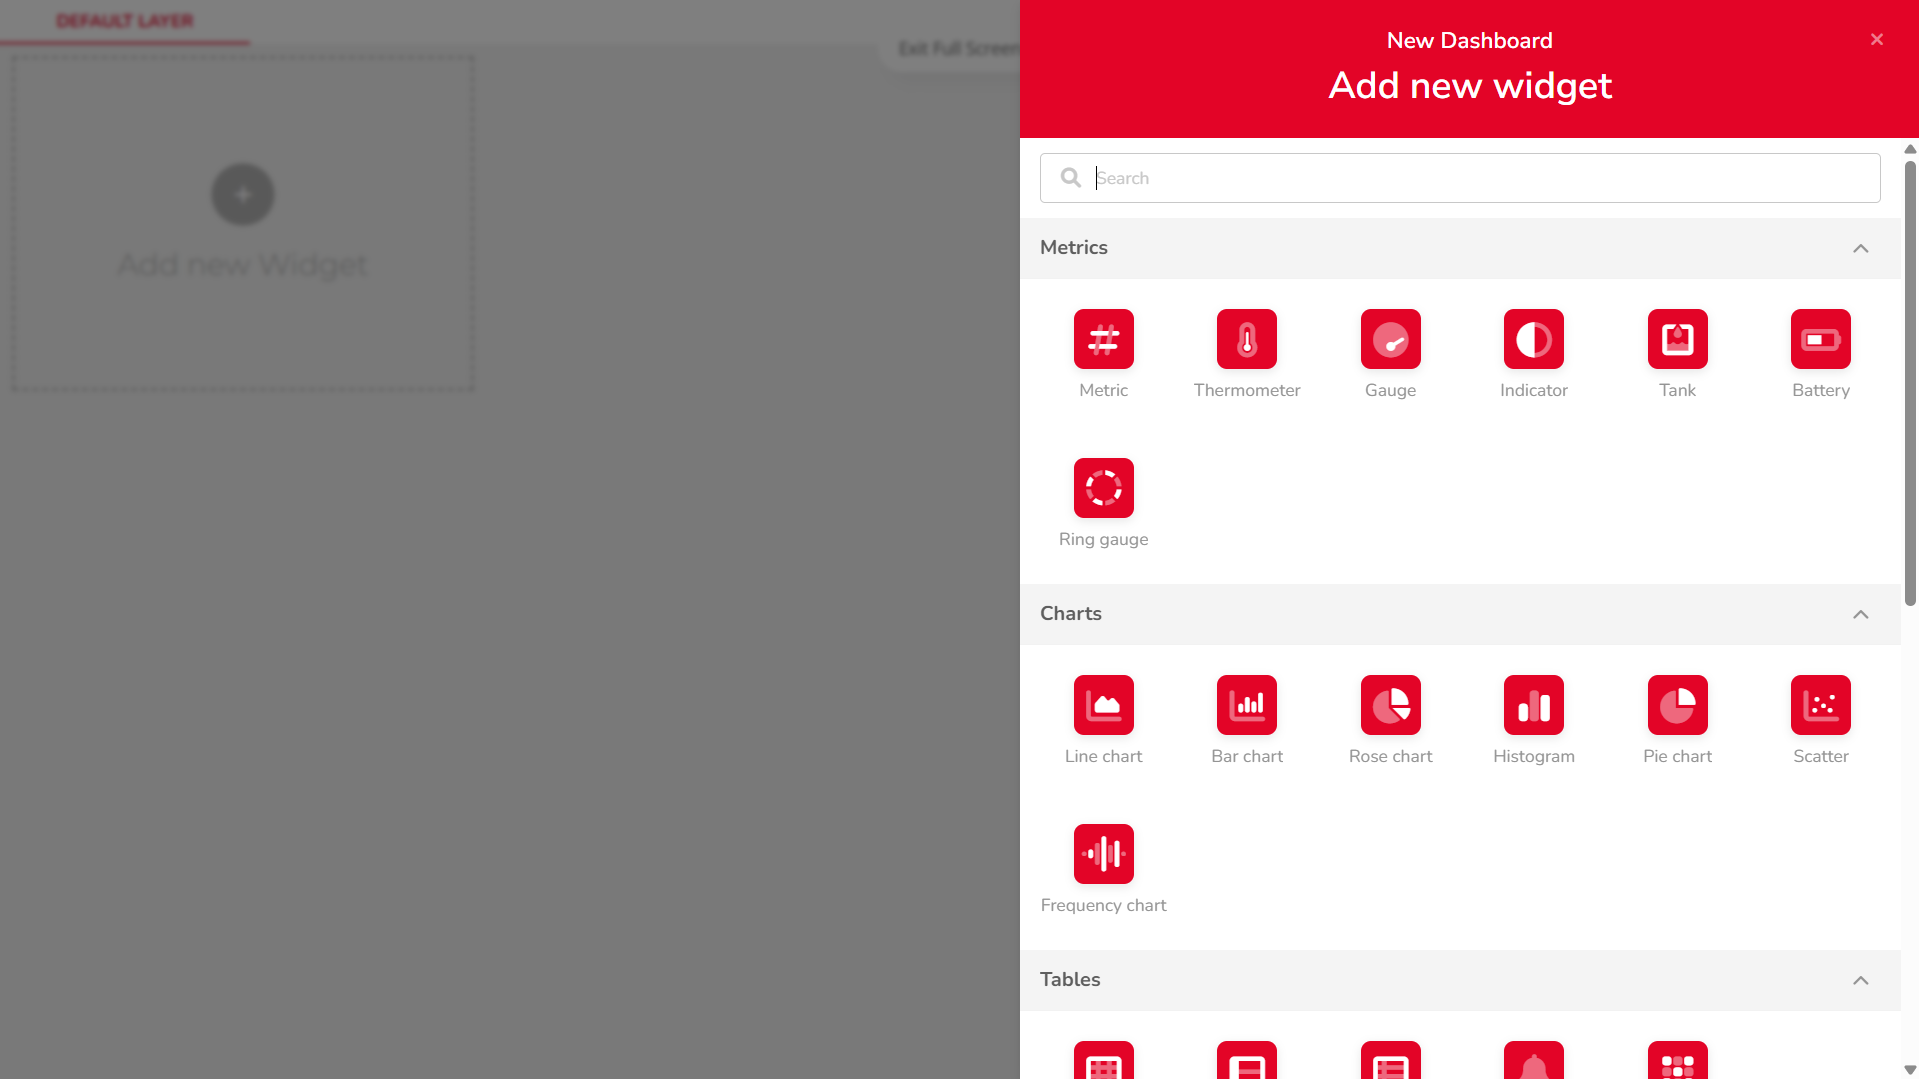
-
Add a Variable
Click on
+ ADD VARIABLES, then:
• Select your device
• Choose the desired variable
• Confirm the selection by clickingSELECT
-
Configure Aggregation and Time Span
Set the
Aggregation Method(e.g. average, last value) andSpan(time range).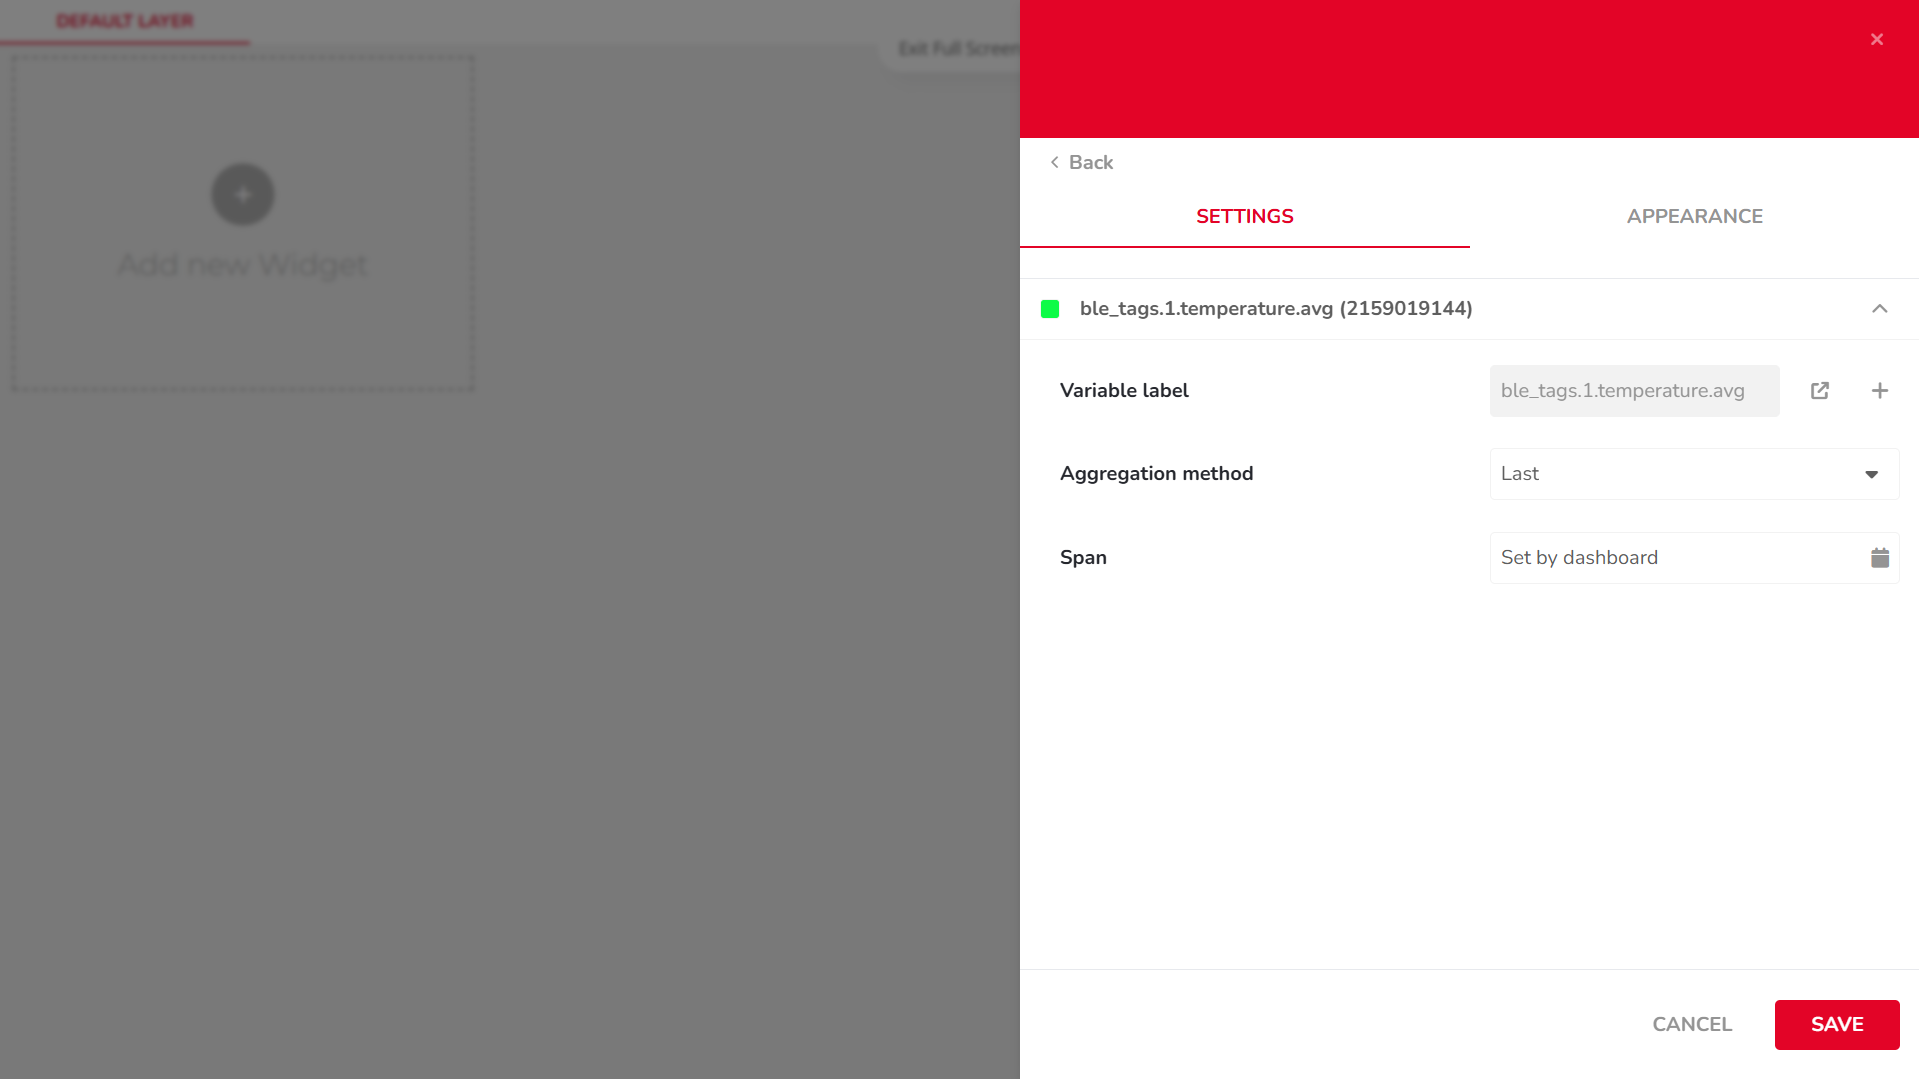
-
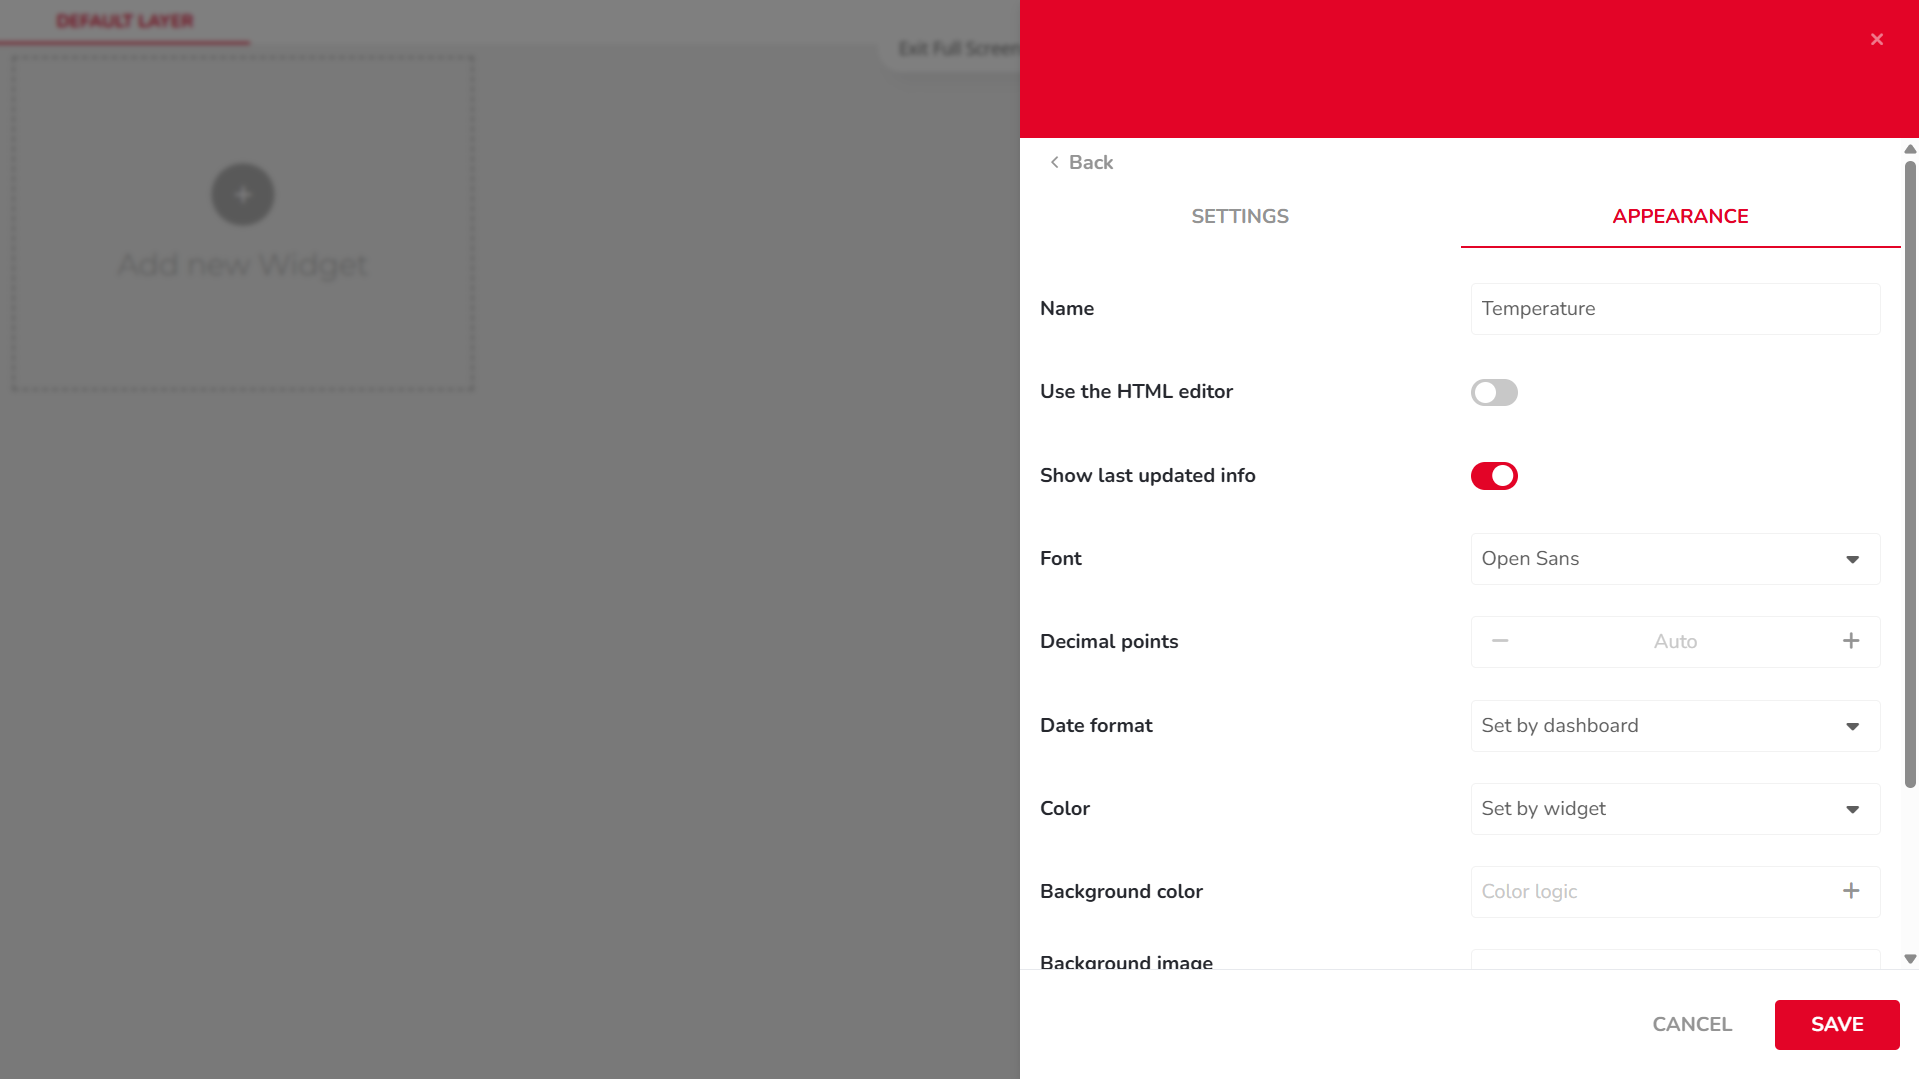
Edit Widget Appearance
Switch to the
APPEARANCEtab to customize display options such as:
• Label
• Color
• Font
• Date format
• ...
-
Save the Widget
Click
SAVEto add the widget to your dashboard.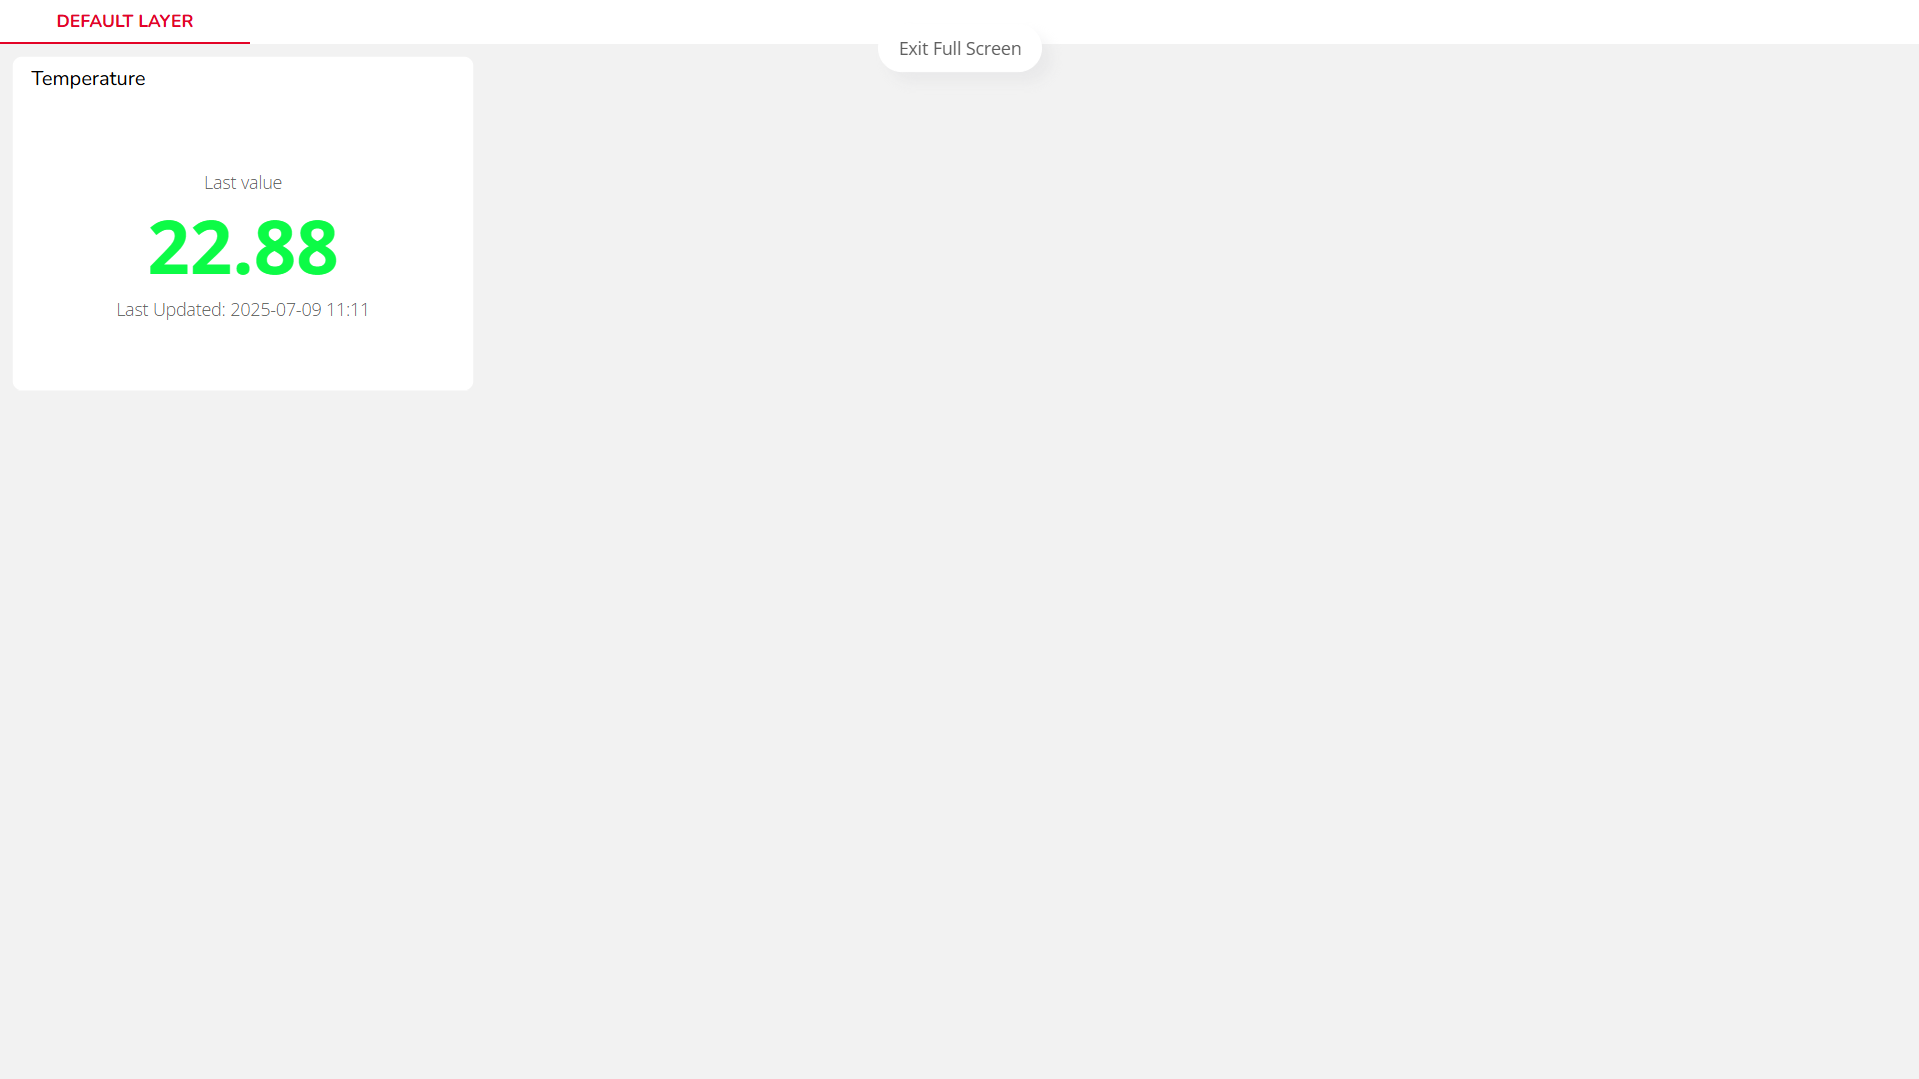
Video Tutorial
If you need further assistance or a visual demonstration of the process described in this guide, consult the Video Guide.