Creating Dashboards
In this guide, you will learn how to create a dashboard, add a simple variable display, and build a basic chart. This will allow you to visualize and monitor your device data in real time.
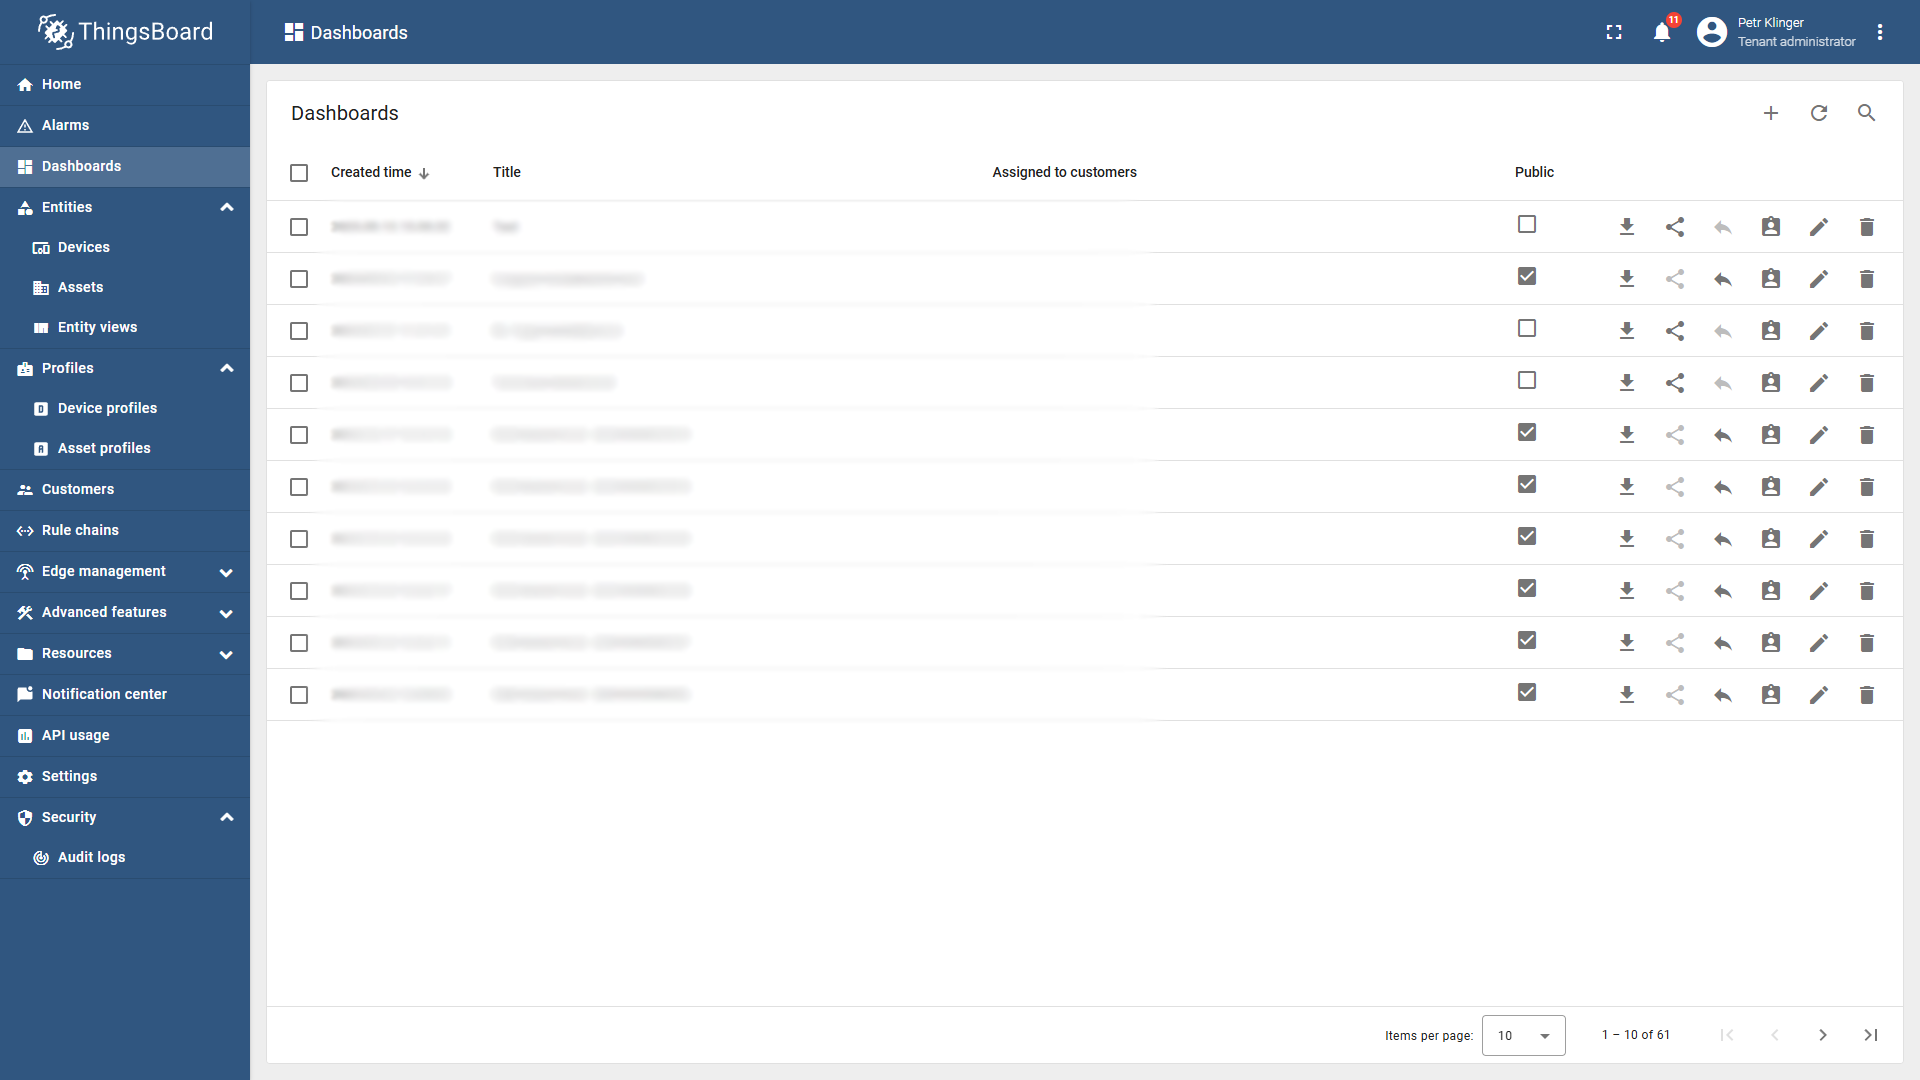
Step 1: How to Create a Dashboard
- Navigate to the left navigation bar.
- Click on the Dashboards tab.
- In the top right corner, click the ➕ button to add a new dashboard.
- Select Create new dashboard.
- Enter the Title, Description, Image, and any other required details.
- Click Add.
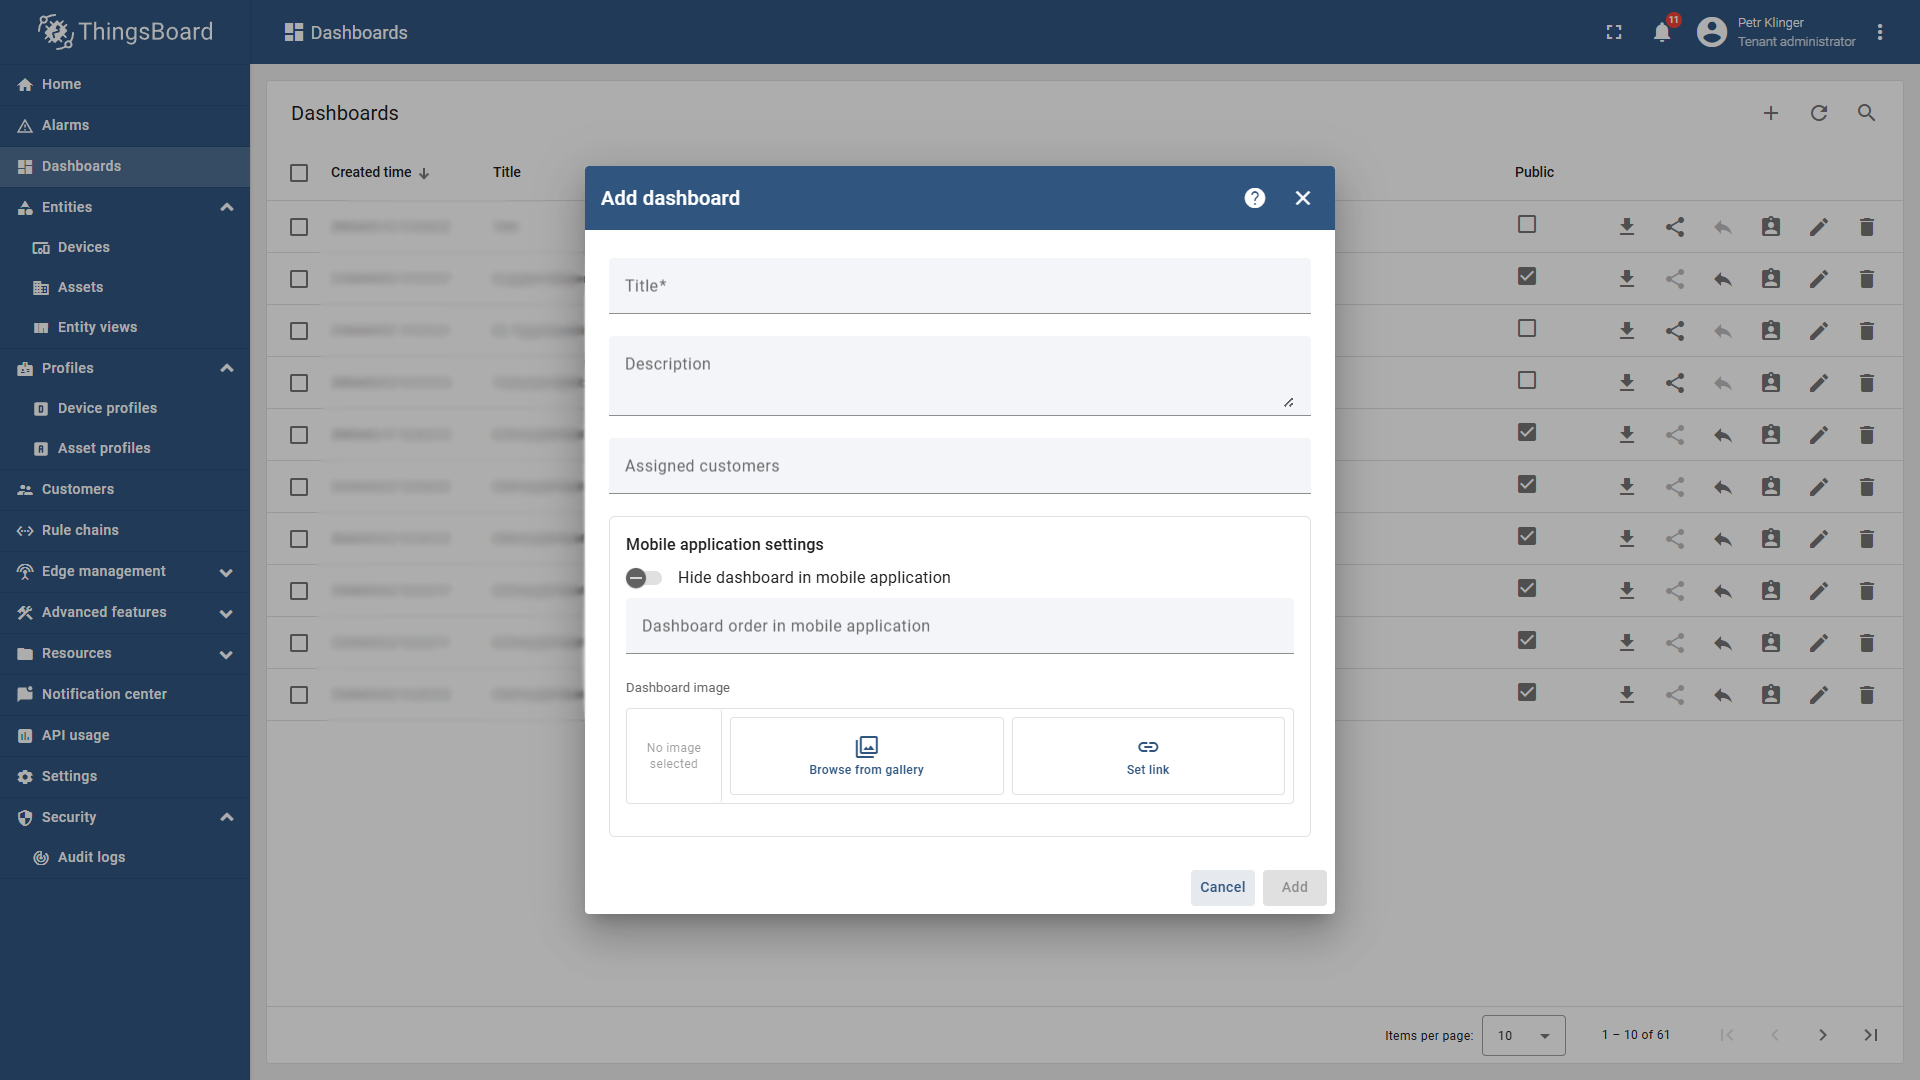
- You will be redirected to your newly created dashboard.
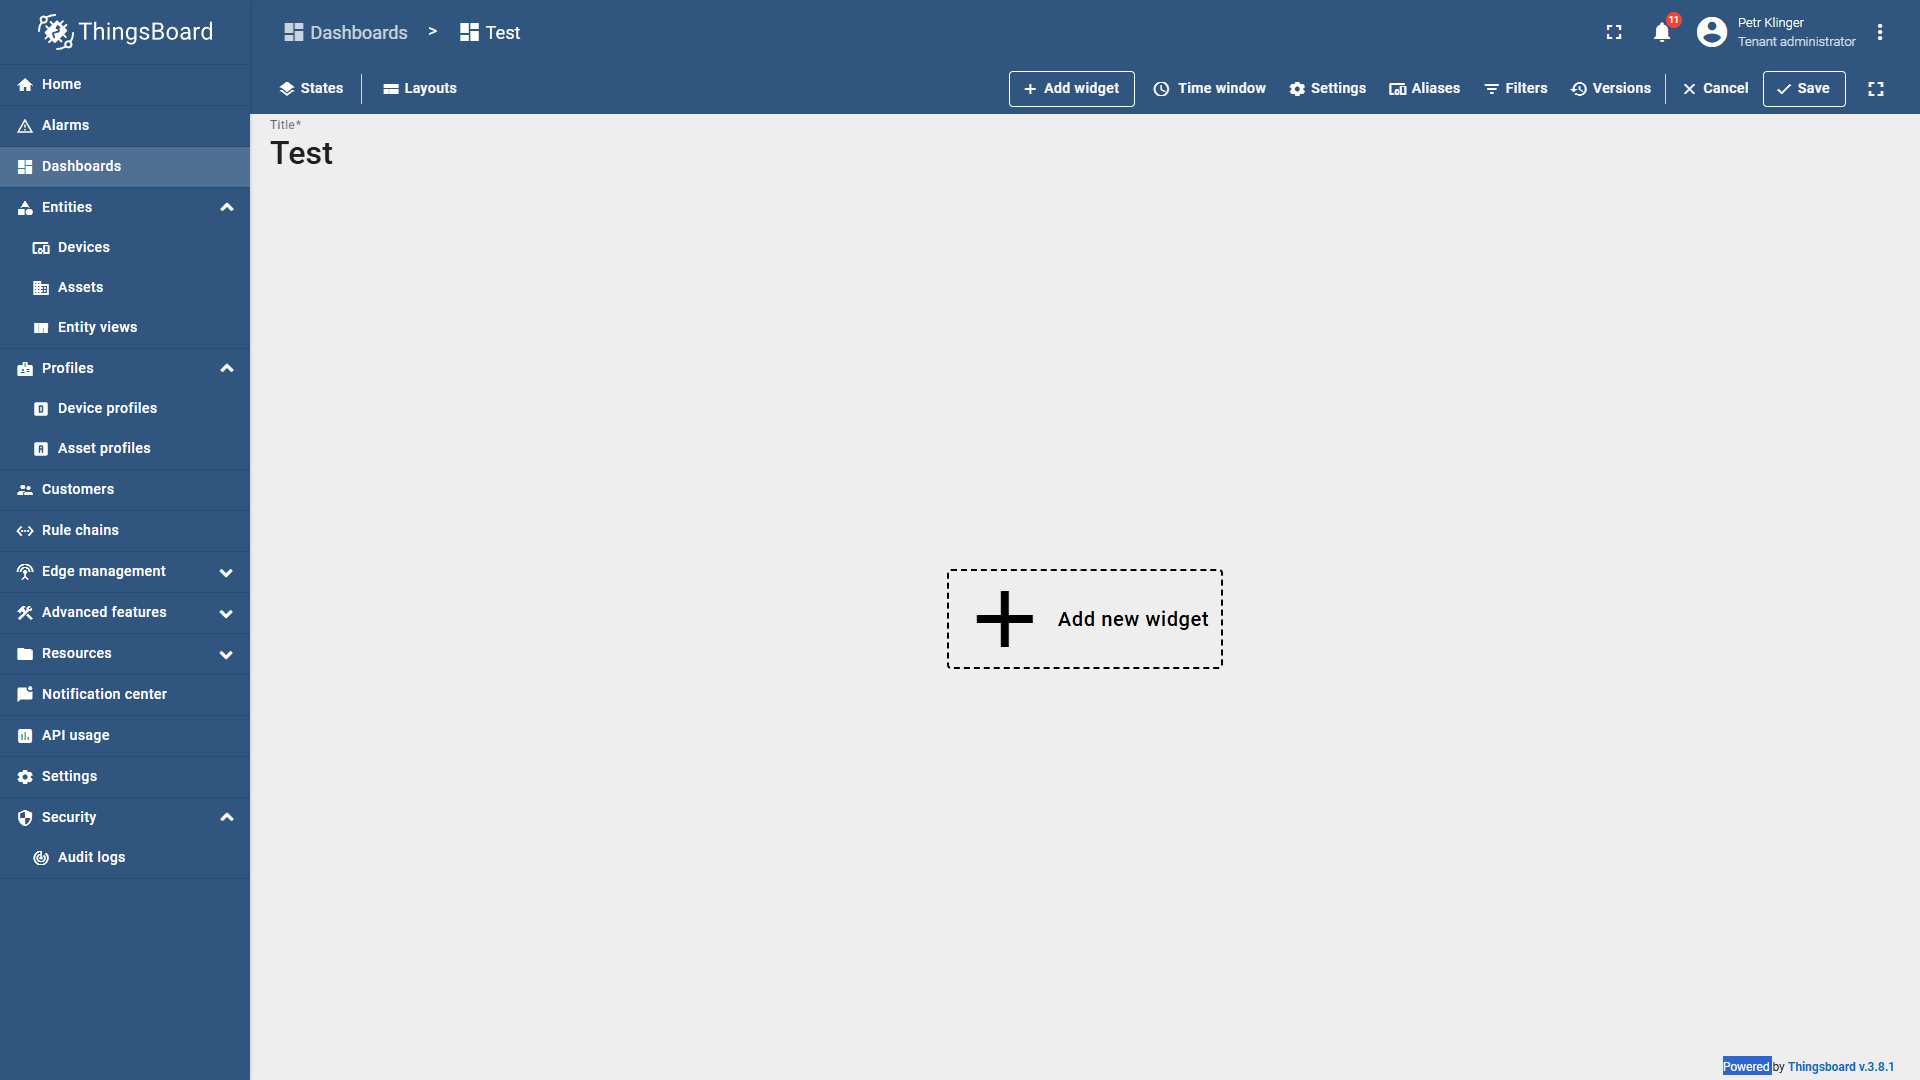
Step 2: How to Create a Simple Variable Display
- Inside your dashboard, click on the + Add new widget button.
- Alternatively, you can use the + Add widget option in the top menu bar.
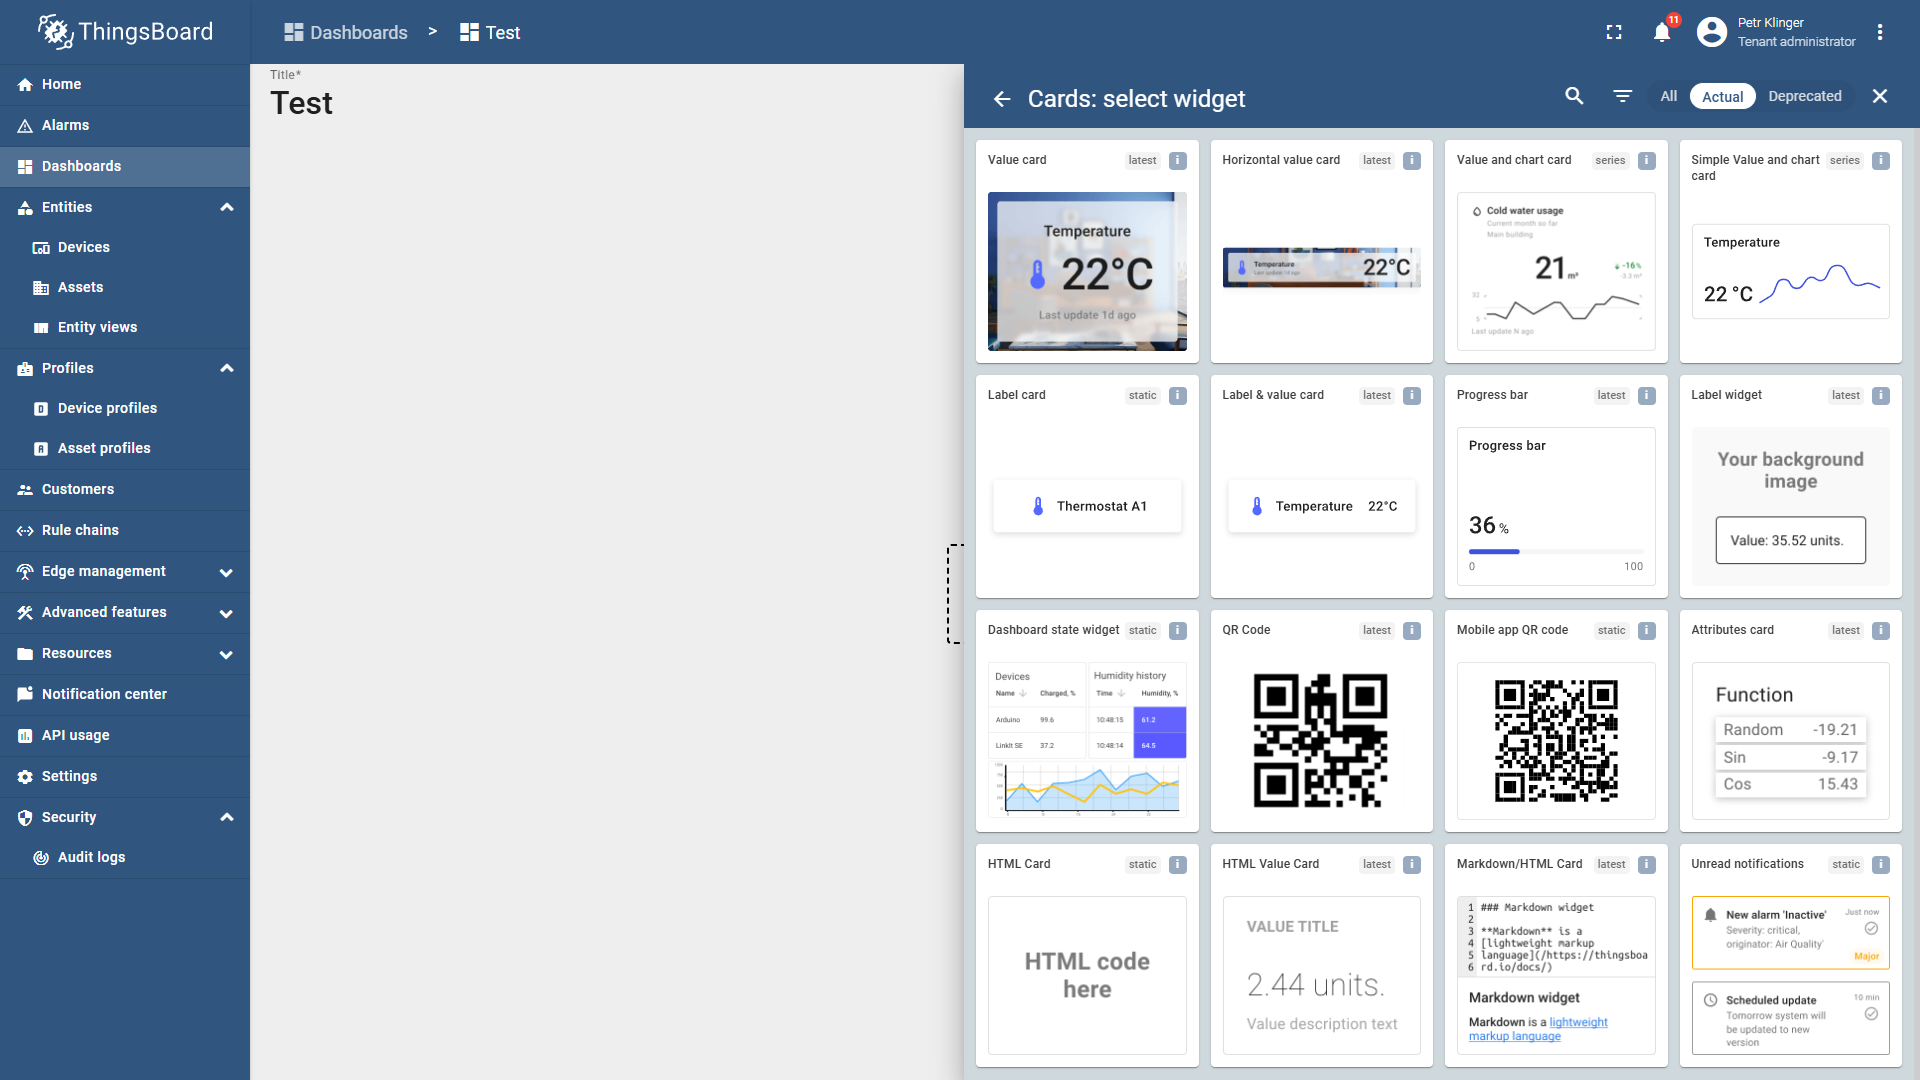
- A Widgets Bundles menu will appear.
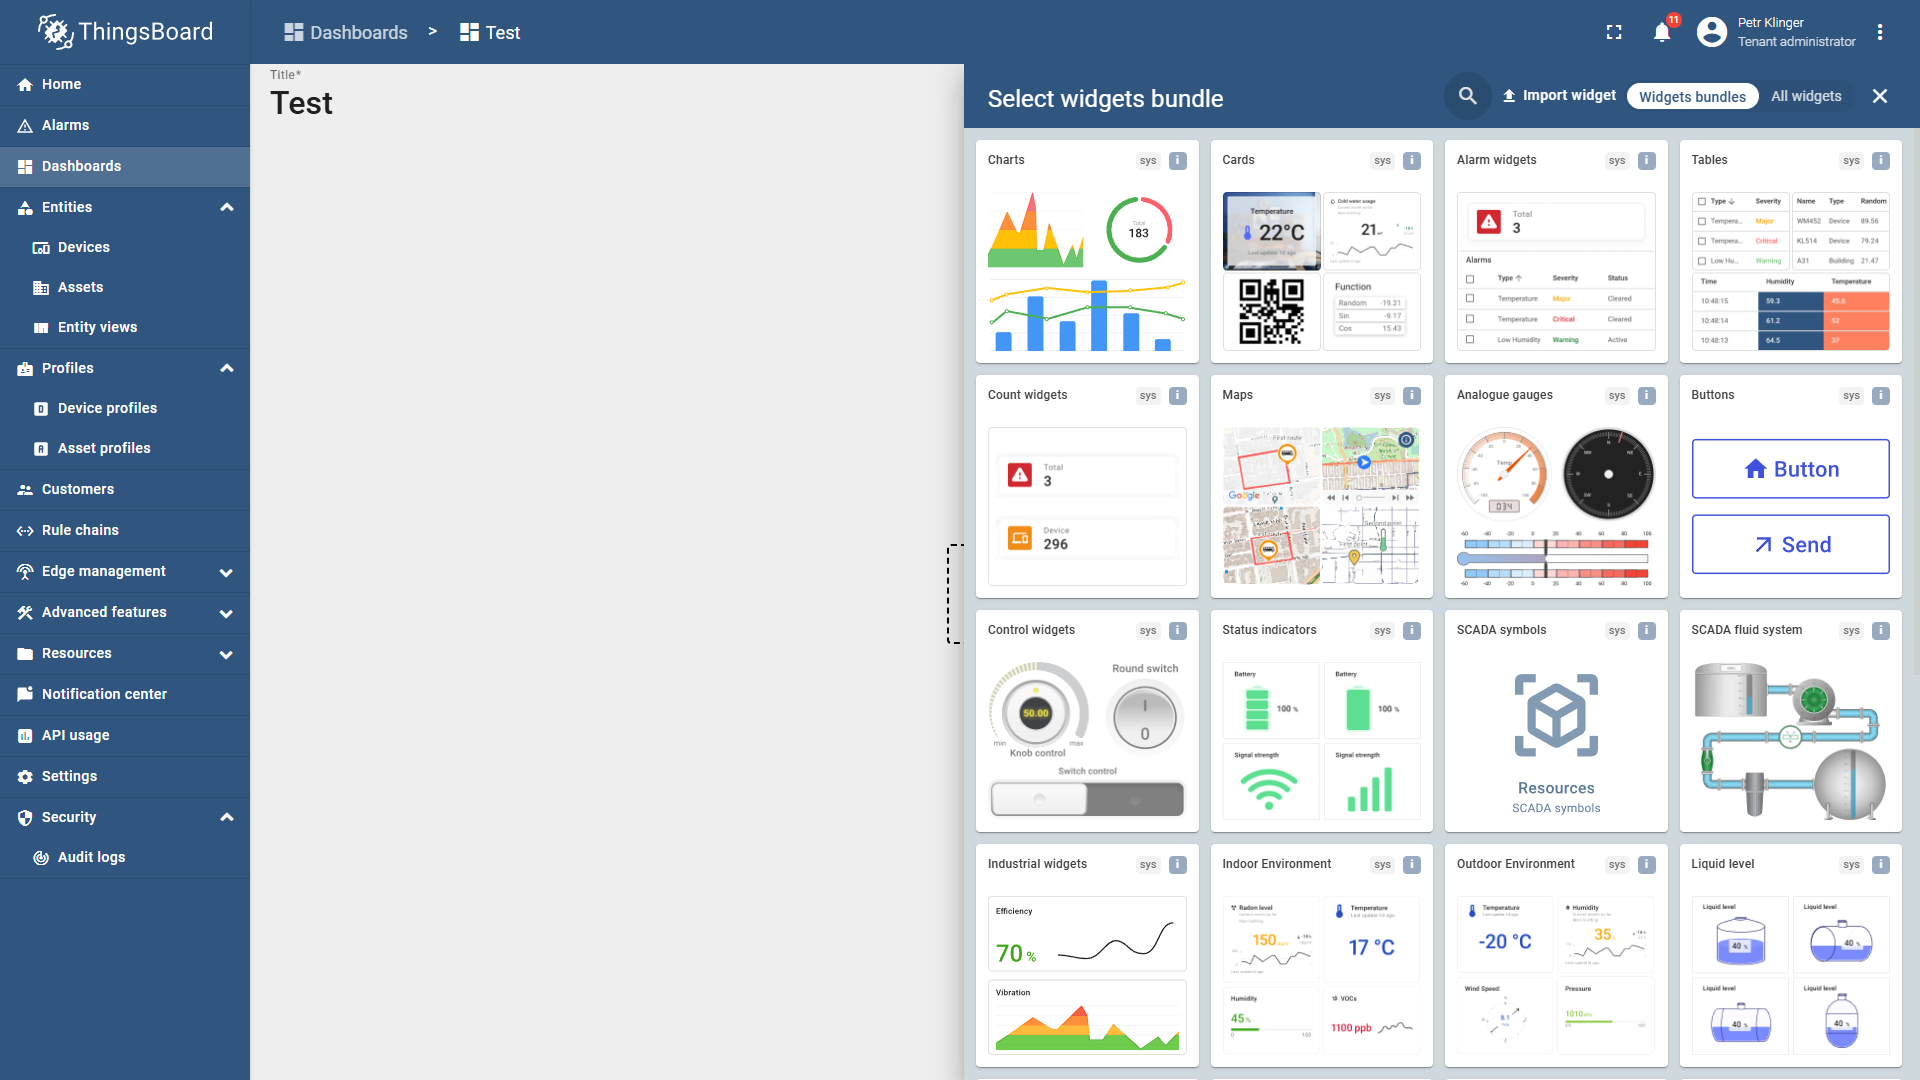
- For a simple variable display, choose the Cards widget bundle.
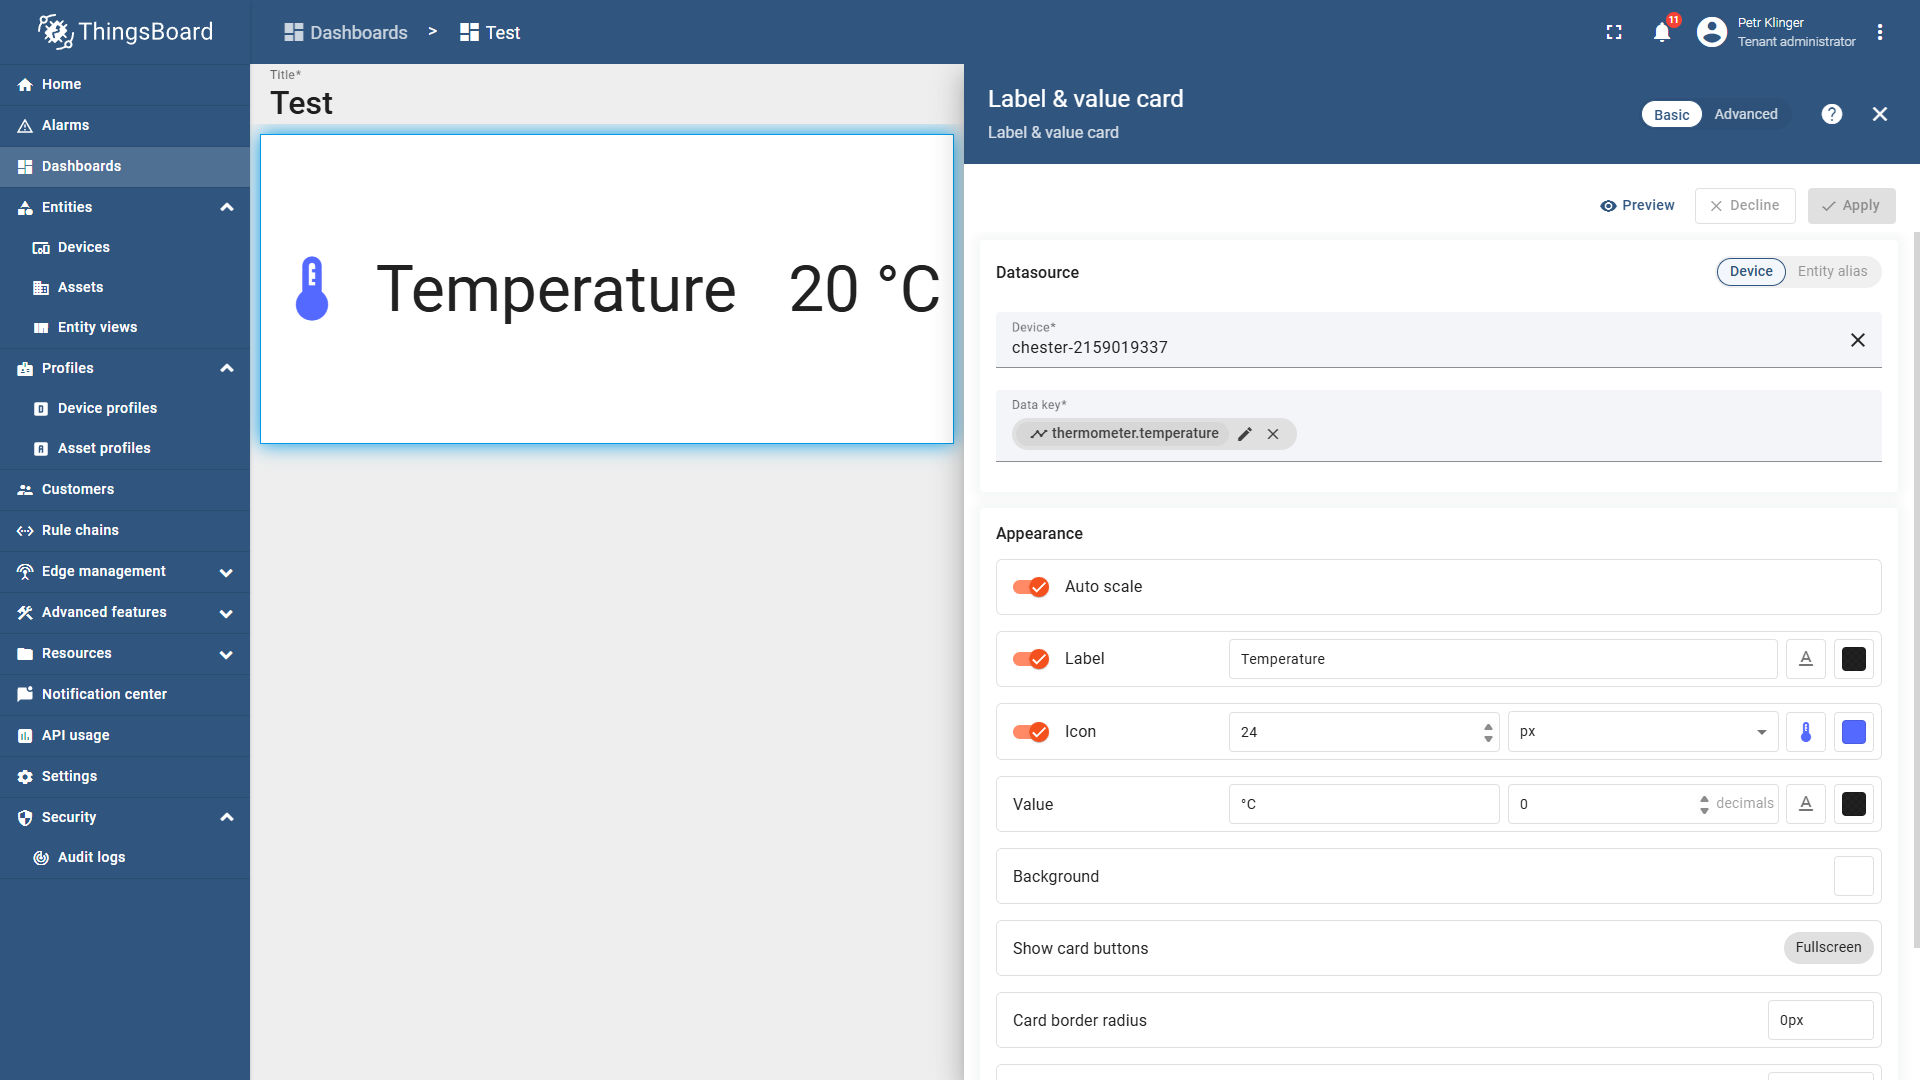
- From the available options, select Label & Value Card.
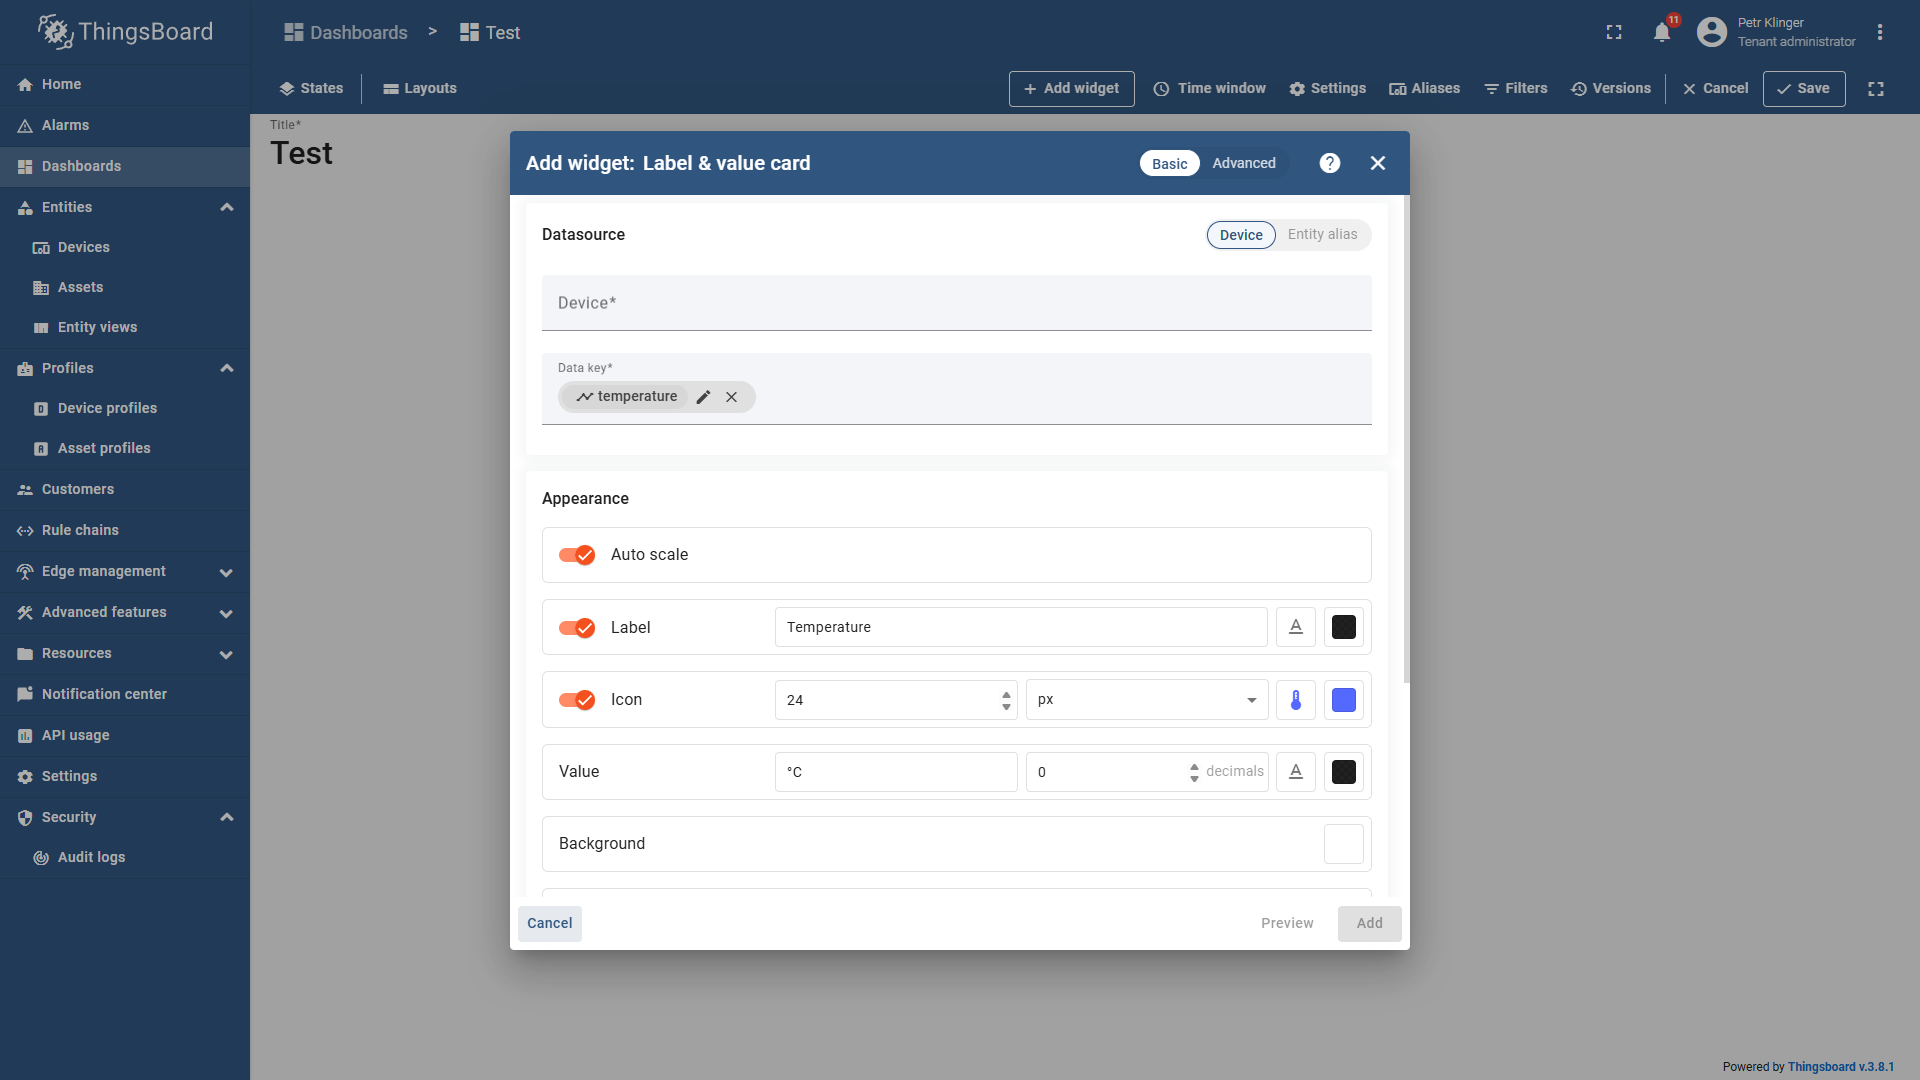
- A configuration window will open:
- Choose the device and the variable you want to display.
- Customize the widget’s appearance (label, color, icon, etc.).
- Once finished, click Add.
- The widget will now appear on your dashboard.
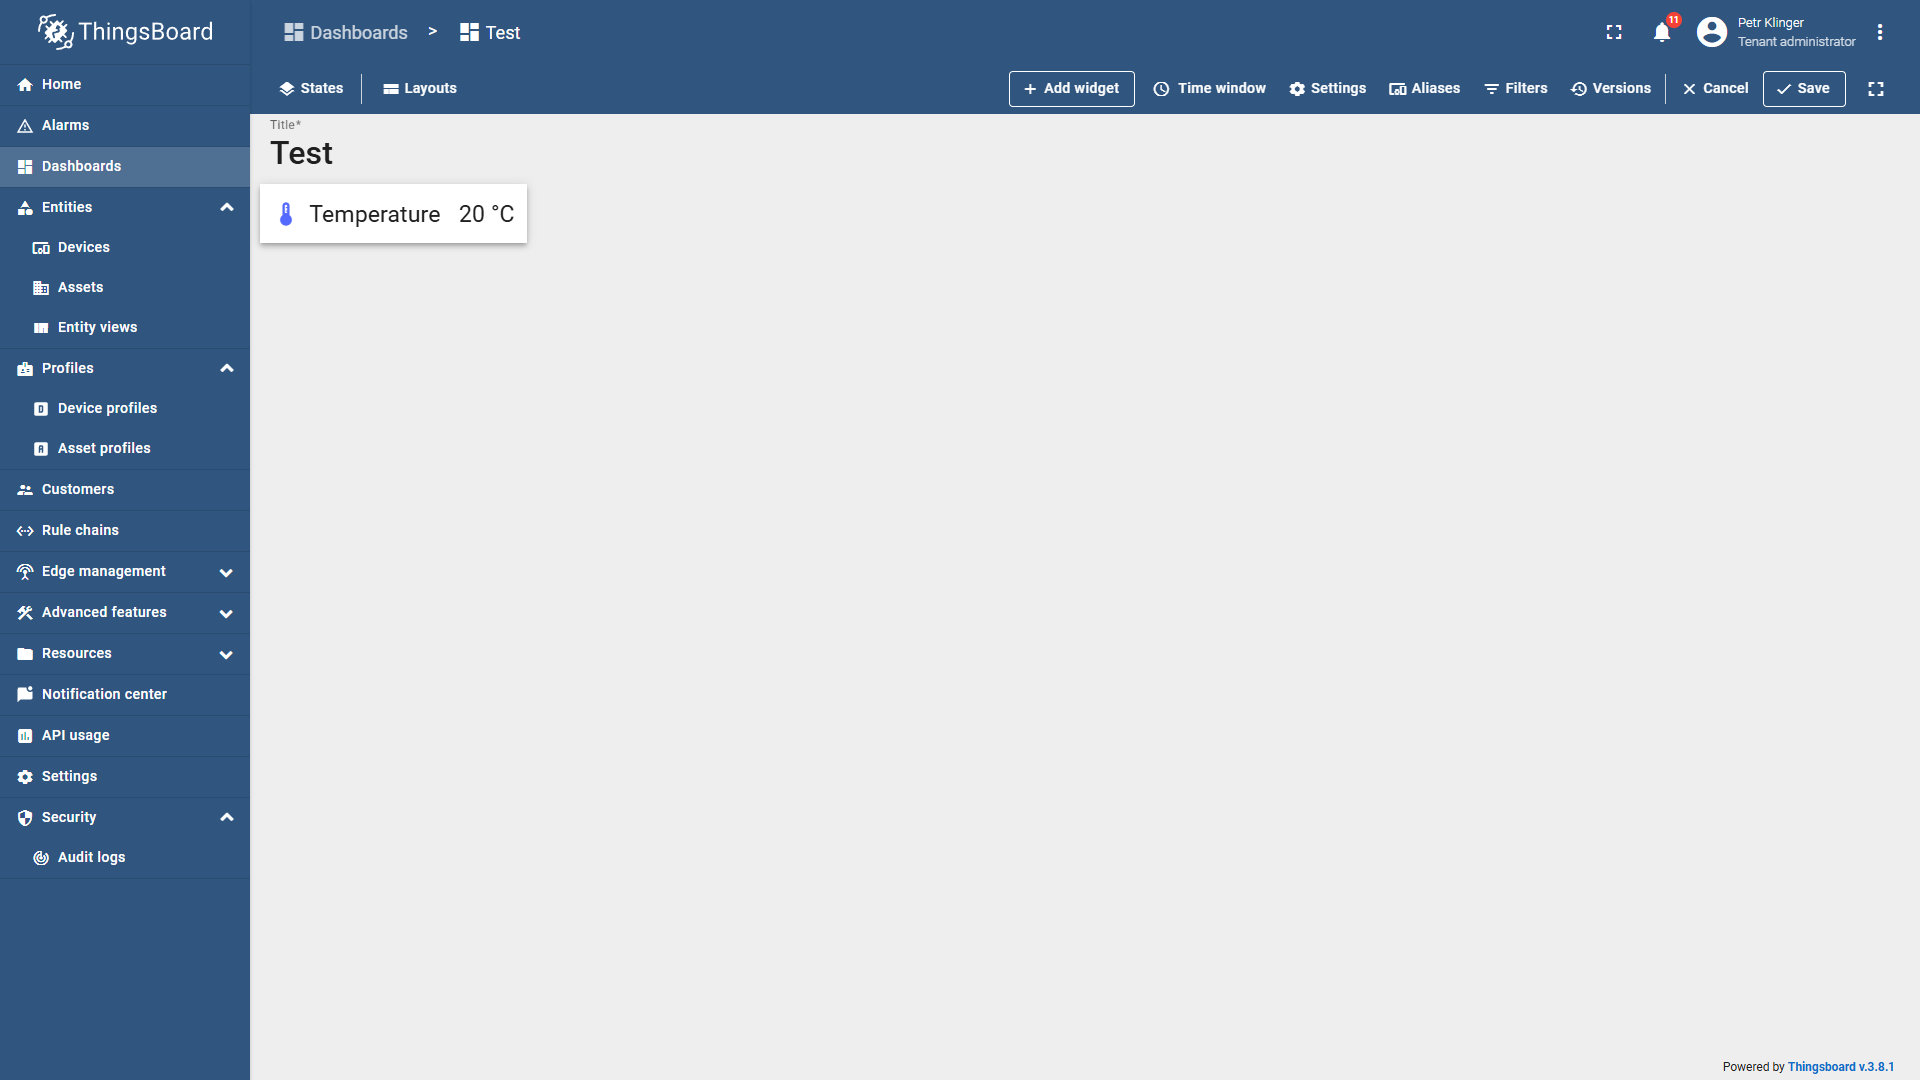
- Resize the widget by dragging its corners.
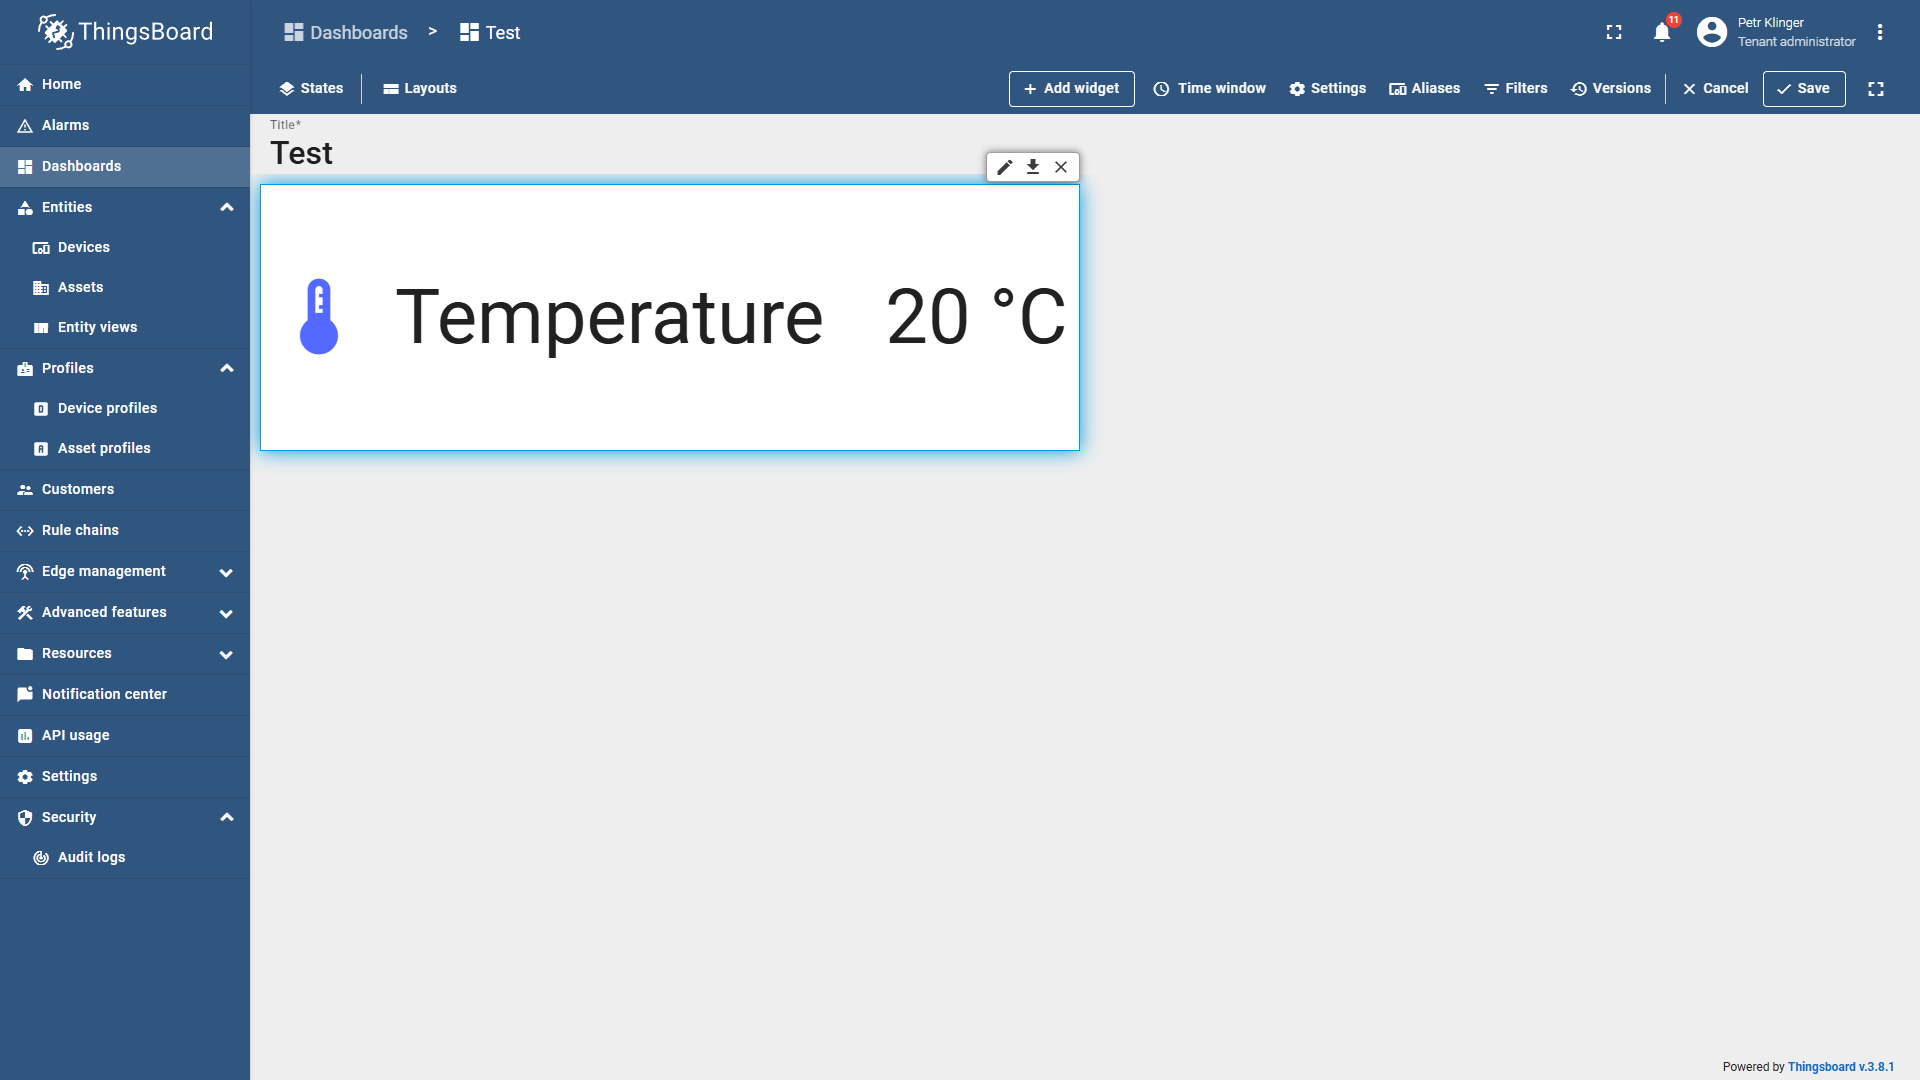
- Re-edit the widget by hovering over it and clicking the pencil icon in the top right corner.
Step 3: How to Create a Simple Chart
- Inside your dashboard, click on the + Add new widget button.
- Alternatively, use the + Add widget option in the top menu bar.

- A Widgets Bundles menu will appear.

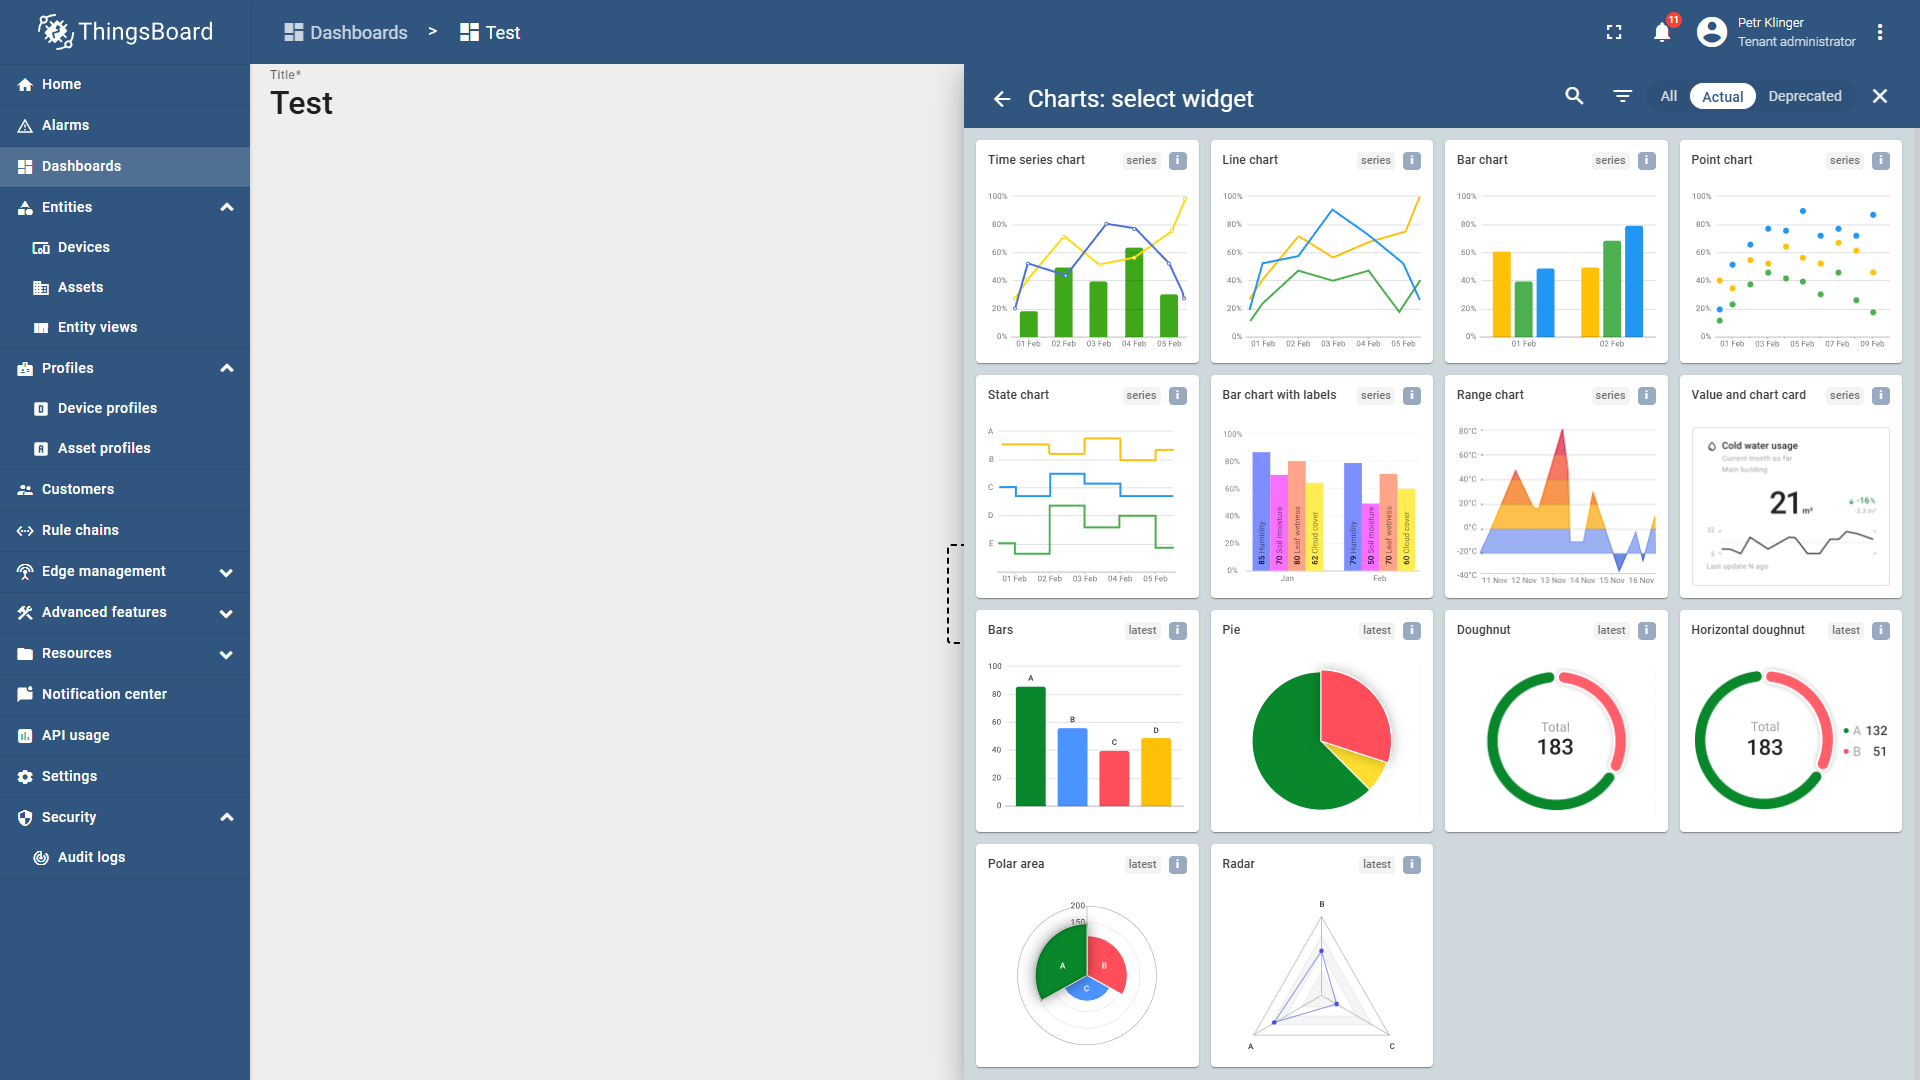
- For a simple line chart, choose the Charts widget bundle.
- From the available options, select Line Chart.
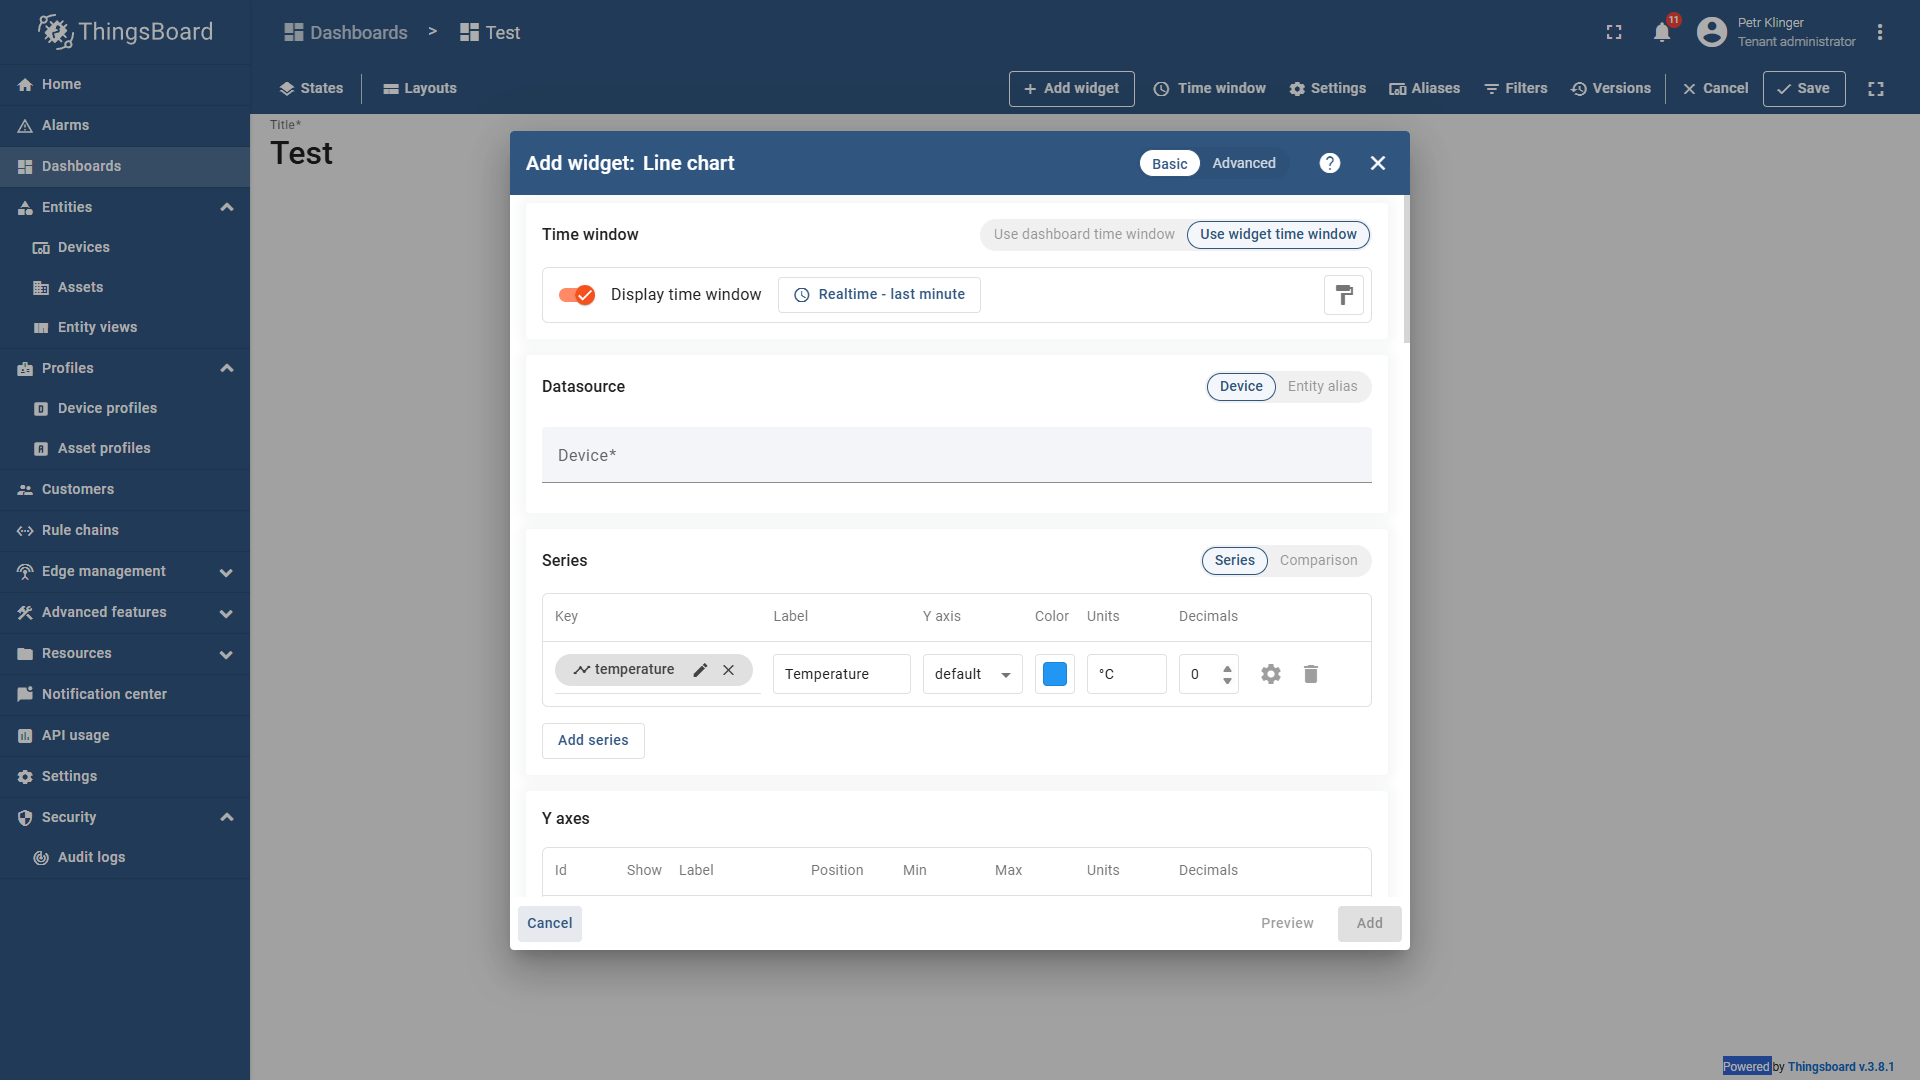
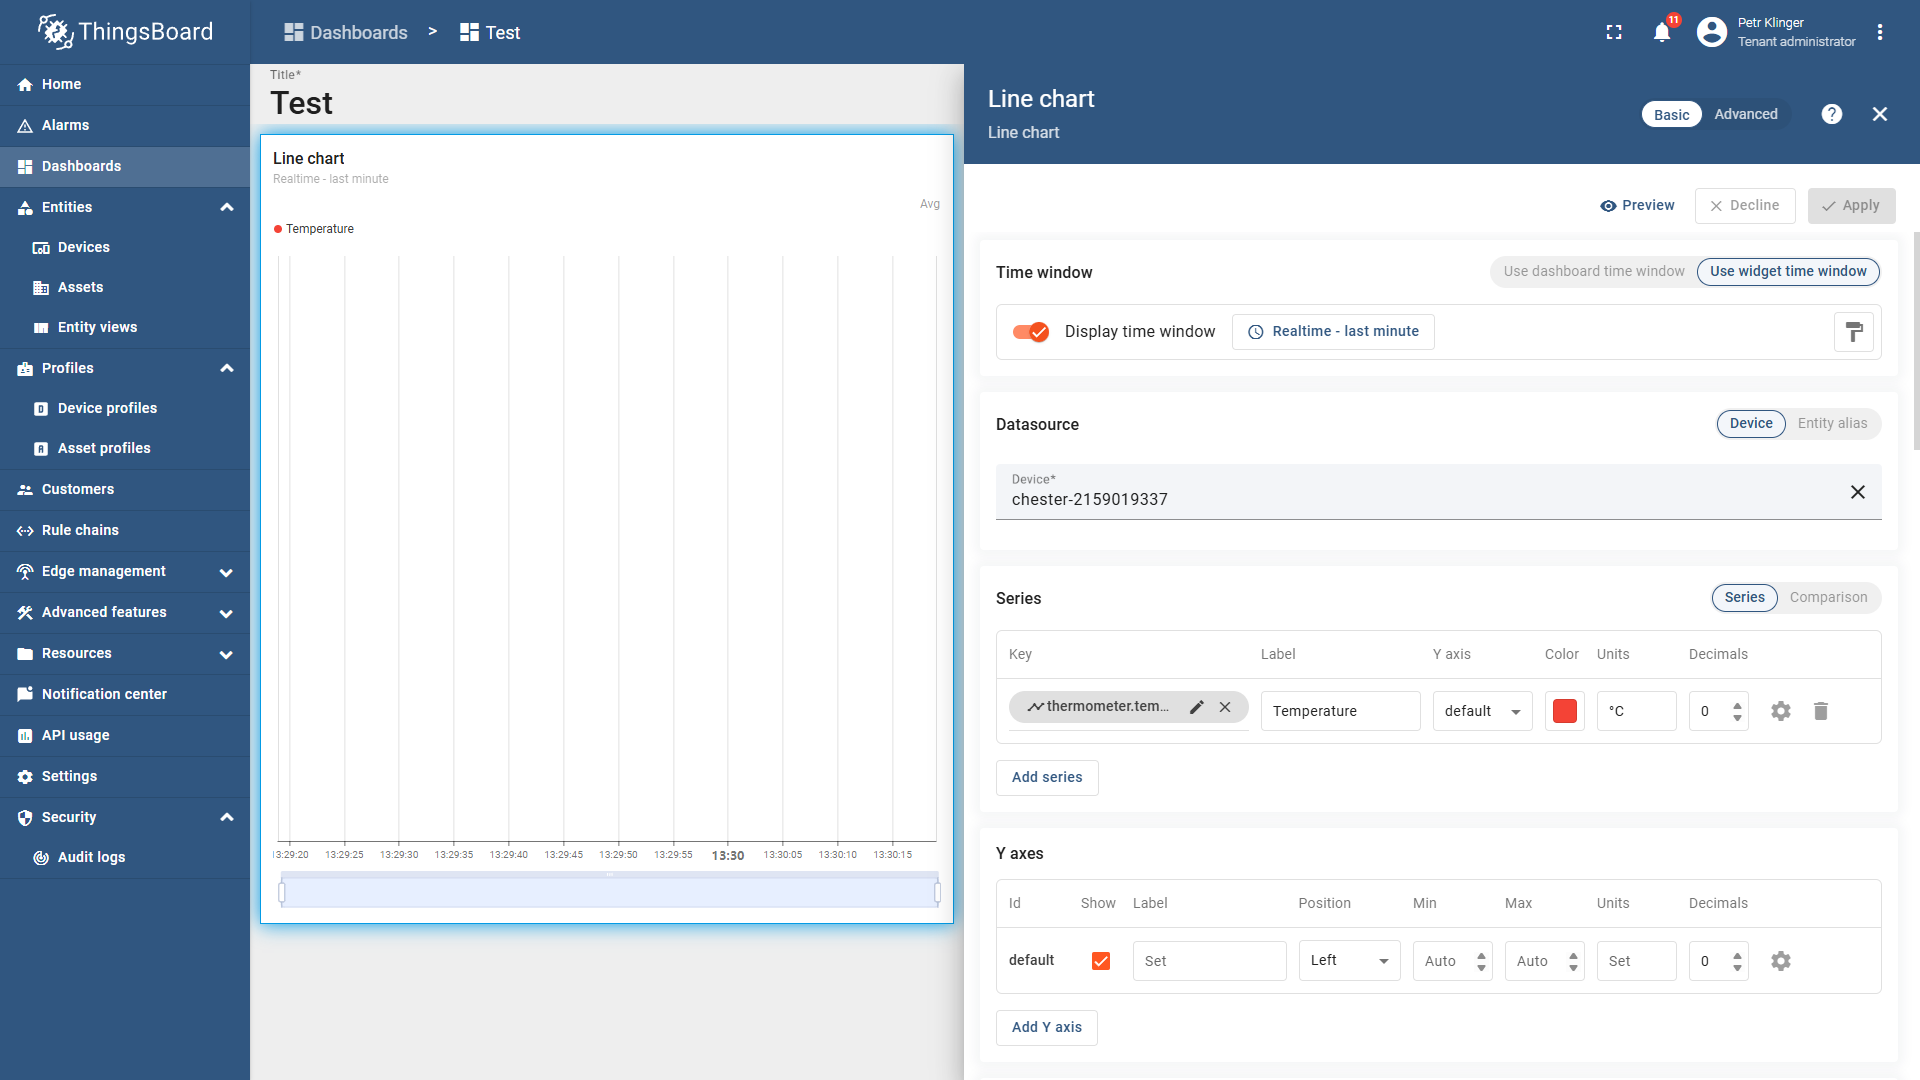
- A configuration window will open:
- Select the data source and the variable you want to display under Series → Key.
- Customize the widget’s appearance (label, units, color, decimals, etc.).
- To add multiple variables, click Add Series.
- Scroll down to configure Y-axes, legend, and other chart settings.
- Once finished, click Add.
- The chart will now appear on your dashboard.
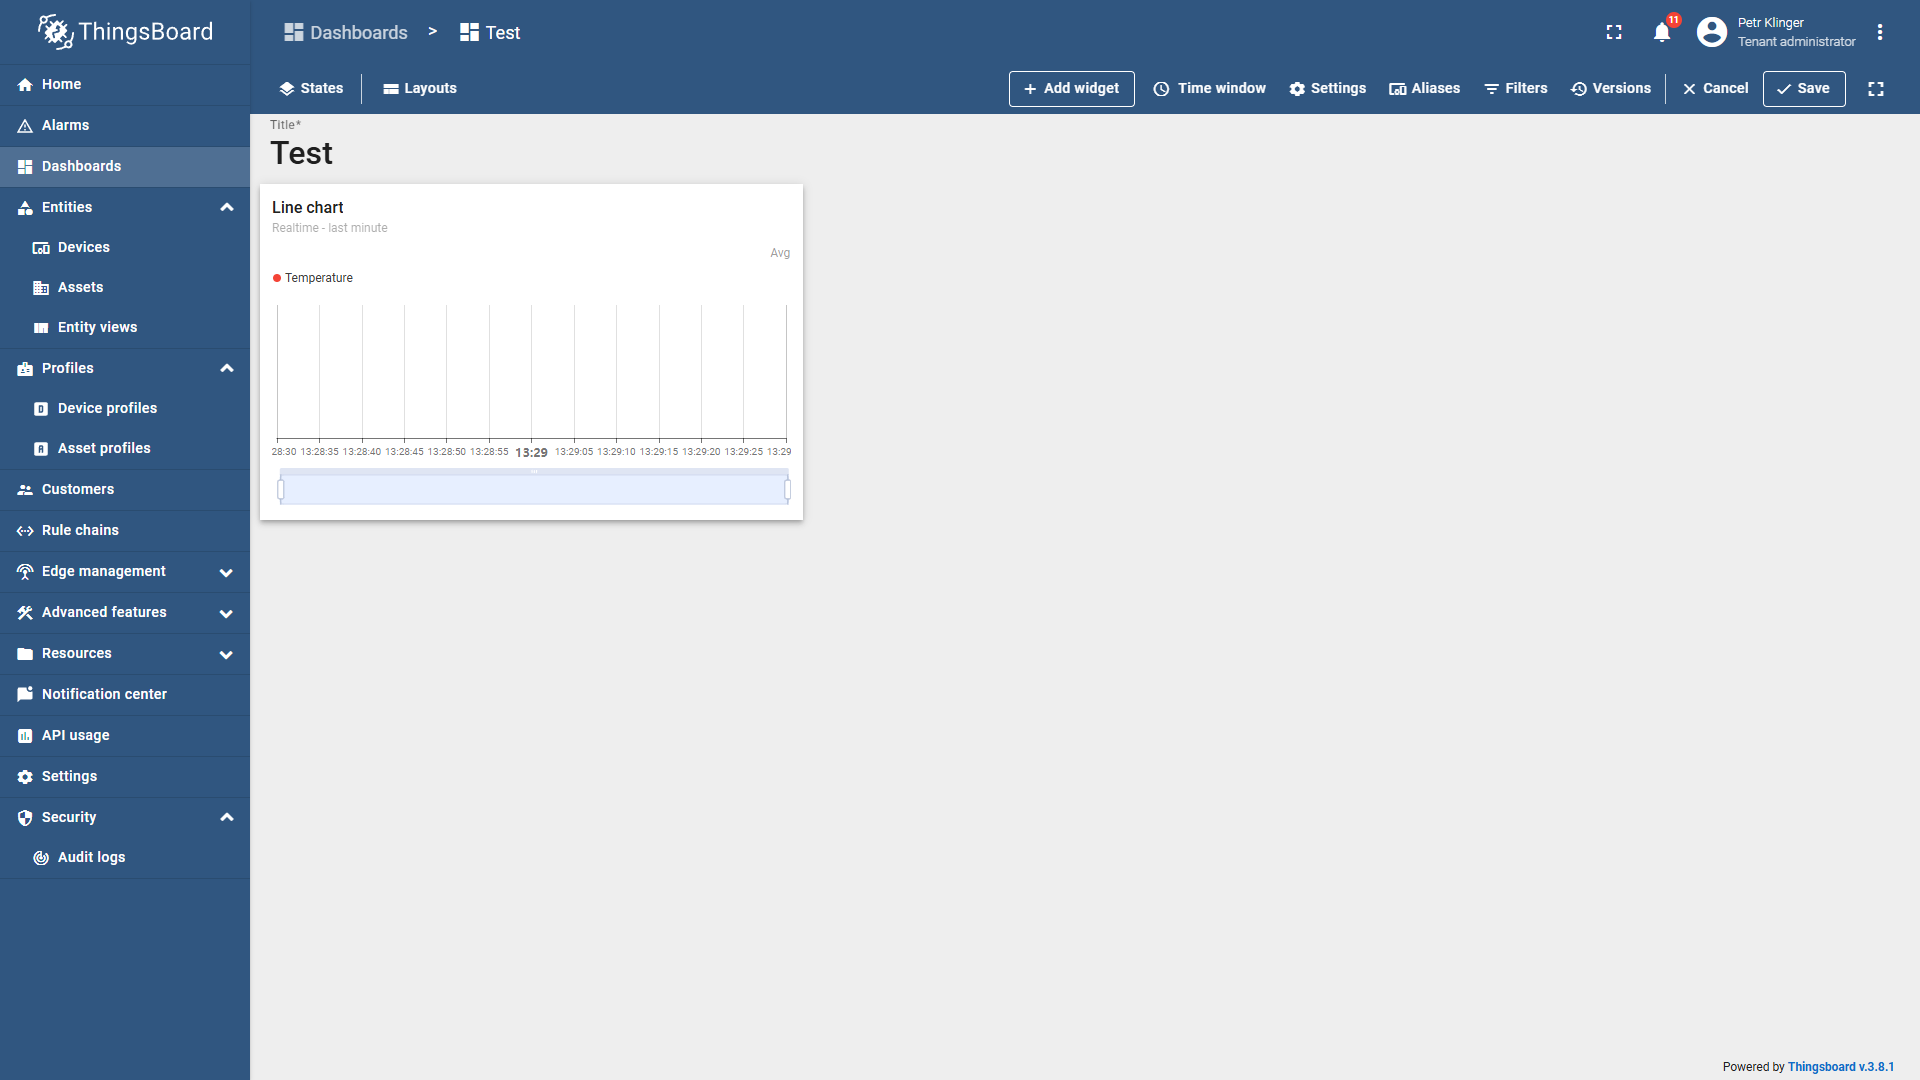
- Resize the chart by dragging its corners.
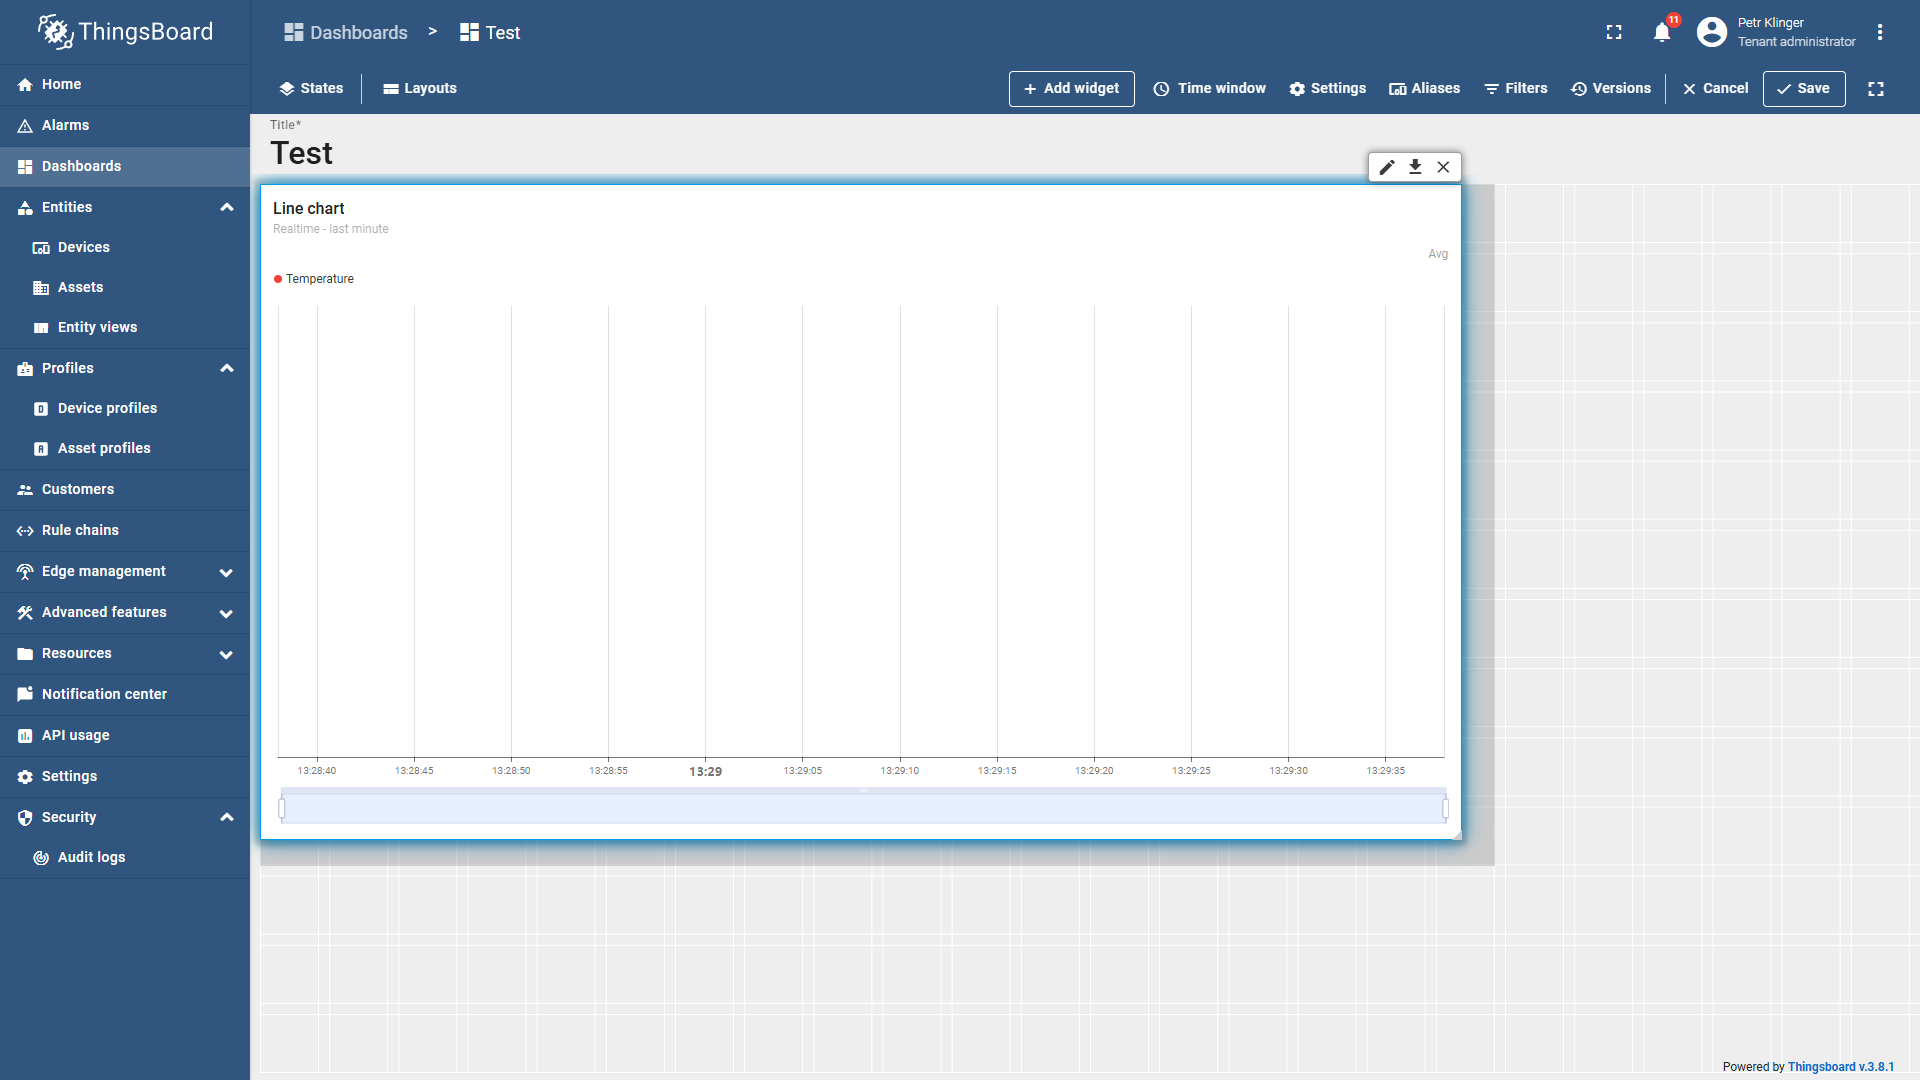
- Re-edit the chart by hovering over it and clicking the pencil icon in the top right corner.
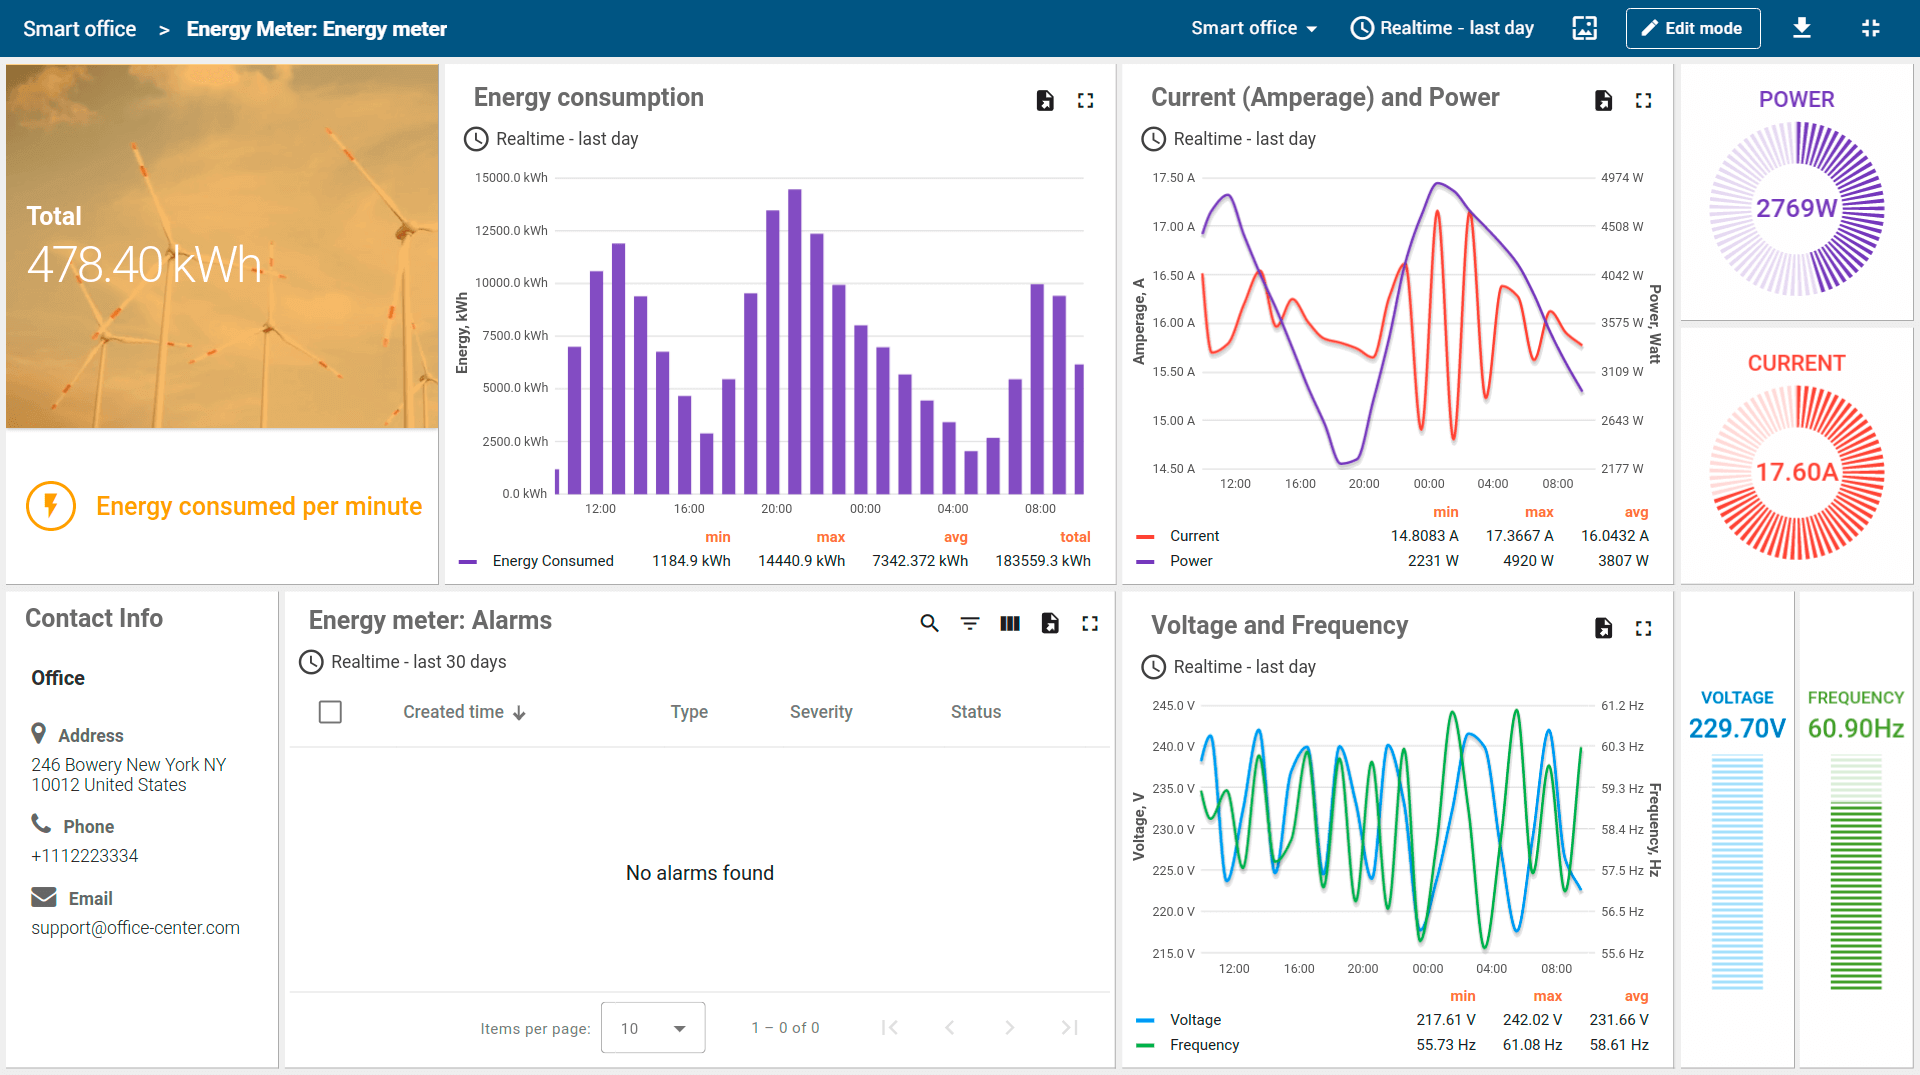
Example of a Created Dashboard
Video Tutorial
tip
If you need further assistance or a visual demonstration of the process described in this guide, consult the Video Guide.