Grafana Visualization
This tutorial is made for the Air Quality Monitor connected to the Raspberry Pi with the Hub installed on it.
You can use our Pre-Installed Image or your own Raspberry where you will install the Hub
Grafana is an open platform for beautiful analytics and monitoring. It allows you to create nice-looking dashboards that will give you quick insights into your sensor data.
Install Grafana
- Linux
- macOS
First, you will need to install InfluxDB.
Start by installing all the needed packages
sudo apt install apt-transport-https curl -y
Add the repository key
curl -sL https://repos.influxdata.com/influxdb.key | sudo apt-key add -
Add repository to the source list
- Debian
- Ubuntu
echo "deb https://repos.influxdata.com/debian stretch stable" | sudo tee /etc/apt/sources.list.d/influxdb.list
echo "deb https://repos.influxdata.com/ubuntu/ xenial stable" | sudo tee /etc/apt/sources.list.d/influxdb.list
Install the InfluxDB Package
sudo apt update && sudo apt install influxdb
Start the InfluxDB Service to test it
sudo systemctl start influxdb
After you tested the InfluxDB, you can move to Grafana.
Install Grafana Dependencies
sudo apt install adduser libfontconfig -y
Install Grafana
- Raspberry Pi
- Desktop
Enable Grafana on Boot
sudo systemctl daemon-reload
sudo systemctl enable grafana-server
Test Grafana
sudo systemctl start grafana-server
Make sure you have Homebrew installed.
First, you will need to install InfluxDB.
Install InfluxDB and Enable It
brew install influxdb
brew services start influxdb
After you installed InfluxDB, you can move to Grafana.
Install InfluxDB and Enable It
brew install grafana
brew services start grafana
Configure Grafana
To configure Grafana, you will first have to open it and log in:
- http://localhost:3000/ - Grafana is running on your local machine
- http://hub.local:3000/ - Grafana is running on your Raspberry Pi with our Hub installed
- http://"IP address":3000/ - Grafana is installed on your device, you should know the IP address of that device
Default User is admin.
Default Password is admin.
To make this part work without any additional configuration you need to follow the tutorial for MQTT Strorage (mqtt2influxdb)
Create a Data Source
Select Add Data Source and fill in the data

- Enter the Name:
node - Select the Type:
InfluxDB - Enter the URL: http://localhost:8086
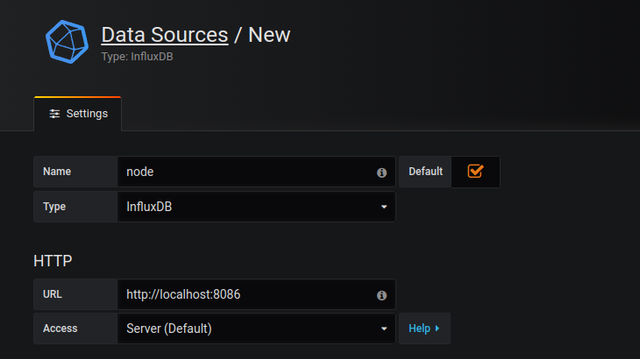
- Enter the Database:
node - Click on
Save & Testbutton to check if everything is OK. You should see the same green notification as in the picture.

Import dashboard
Download dashboard.json and import it to Grafana
- Click the Grafana icon on the top left (1)
- Click on the + icon to expand the submenu (2)
- Click on the Import (3)

- Click on the Upload .json File (4)

- Choose your JSON file (in our case dashboard.json) (5)
- Select the file to upload (6)

- Select your database (7)
- Click on the Import button (8)

- Your dashboard is imported.
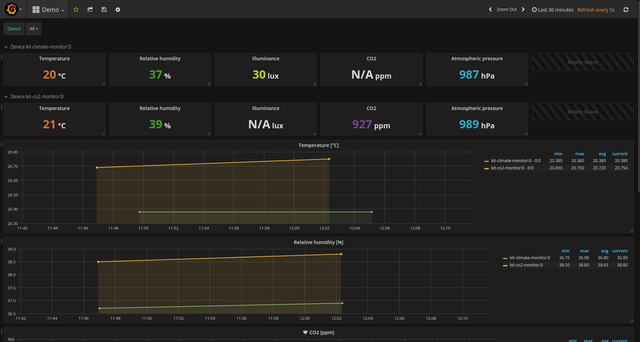
Example output for Wireless Climate Monitor and Wireless CO2 Monitor projects