TOWER Extension Tutorial
This tutorial expects that you have a running Visual Studio Code with our HARDWARIO TOWER extension or HARDWARIO Code installed.
This extension makes it possible to simply develop, flash and debug firmware for HARDWARIO TOWER.
The extension has two operating modes:
In both modes, you should see the HARDWARIO logo on the side panel.
- If you have some HARDWARIO TOWER firmware open (Firmware Mode)
- If you have anything else or nothing open (Basic Mode)
Basic Mode
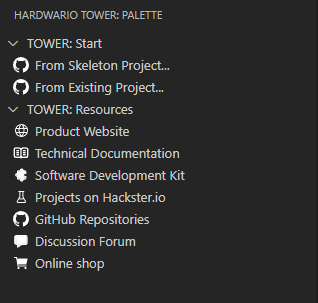
If you didn’t open a folder with HARDWARIO TOWER firmware the extension will activate but will provide fewer options.
You will get access to some basic commands that will lead you to our websites and then two commands for cloning firmware from our GitHub.
You can use these commands to get started with the firmware development.
From Skeleton Project…
You will be prompted to select a folder where the twr-skeleton firmware should be cloned (A new folder for the firmware will be created).
After you select the folder you should name your firmware folder so you don’t have some collisions with other firmware folders.
From Existing Project…
You will be provided with a list of existing firmware for HARDWARIO TOWER available on our GitHub. You can select any of them based on the name and description of the firmware.
You will be prompted to select a folder where the selected firmware should be cloned (A new folder for the firmware will be created). After you select the folder you can name your firmware folder so you don’t have some collisions with other firmware folders.
After you clone the firmware the window will be reopened with the firmware folder opened.
Firmware Mode
If you are using standard firmware, the /src/application.c file should be opened at the start so you can start developing right away.
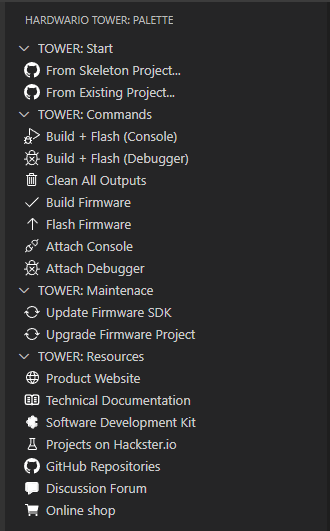
In this mode, you will get some additional controls on the bottom panel and the side panel.
On the bottom panel, there are some important controls that you can quickly use, without the need for the side panel controls
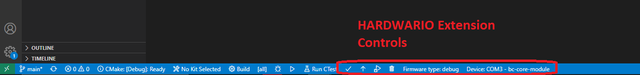
Device selection Device: COM3 - bc-core-module
With this, you will have to select the device that you want to work with. If you have no HARDWARIO devices connected there will be a No Device found! prompt. If you have multiple devices connected, you can browse through them by clicking on the text.
Firmware type selection Firmware type: Debug
You can choose if you want to build in Debug or Release mode. For normal development, we recommend using the default debug setting because it enables logging.
There are other icons that you can use which will be described later, with the commands that they call.
Build + Flash (Console)
This command will do the whole cycle that you can use while developing**. It will build the firmware, flash it to the selected device and then attach the console for the device to see the log messages.
You can use this most of the time while developing.
There is a separate chapter for the TOWER Console.
Build + Flash (Debugger)
You will need a JLink Probe for this to work properly. This is for advanced debugging. You have to have arm-none-eabi-gdb and JLinkGDBServerCL in PATH for this to work. If you are using our portable version you don’t have to worry about that and you just need the JLink Probe.
This command will not attach the console like the previous one but will instead try to attach it to the JLink debugger for some advanced debugging. You can read more about JLink debugging in the Advanced Debugging chapter.
Clean All Outputs
This command will clean all the outputs so you can recompile everything from scratch.
Build Firmware
This command will run CMake and ninja on the code. You can check if you have some errors or warnings in the code before you flash it into the device.
Flash Firmware
This command will flash the firmware onto the selected device. It will also run the build command in case you didn’t do that before or forgot to rebuild the changes.
Attach Console
This command will attach the console to the selected device so you can view the log messages.
There is a separate chapter for the TOWER Console.
Attach Debugger
You will need a JLink Probe for this to work properly. This is for advanced debugging. You have to have arm-none-eabi-gdb and JLinkGDBServerCL in PATH for this to work. If you are using our portable version you don’t have to worry about that and you just need the JLink Probe.
This command will try to connect to a JLink for advanced debugging.
You can read more about JLink debugging in the Advanced Debugging chapter.
Debugging can be started in multiple ways:
Press the F5 button with some *.c or *.h file in focus
There shouldn't be launch.json present in the .vscode folder.
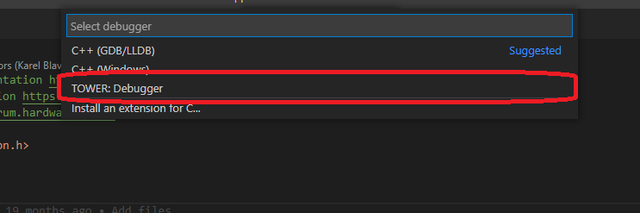
If you want to just run the debug and not change anything in the launch.json you can just press F5 and select TOWER Debugger. Debugging should start with no problem
Go to the Run and Debug and create launch.json
If you want to have your custom launch.json you can go to the Run and Debug window on the side panel and click create a launch.json file and select TOWER Debugger. or add this configuration to an existing one.
{
    "name": "HARDWARIO TOWER Debug",
    "request": "launch",
    "type": "cortex-debug",
    "cwd": "${workspaceFolder}",
    "device": "STM32L083CZ",
    "servertype": "jlink",
    "jlinkscript": "./sdk/tools/jlink/flash.jlink",
    "interface": "swd",
    "serverpath": "${command:hardwario-tower.locate_jlink}",
    "svdFile": "./sdk/sys/svd/stm32l0x3.svd",
    "gdbPath": "${command:hardwario-tower.locate_toolchain}",
    "runToEntryPoint": "application_init",
    "executable": "${workspaceFolder}/out/debug/firmware.elf",
    "windows": {
        "gdbPath": "${command:hardwario-tower.locate_toolchain}.exe",
        "serverpath": "${command:hardwario-tower.locate_jlink}.exe"
    }
}
Press Attach Debugger in the HARDWARIO Extension command palette
You can use this option if you don’t want to worry about launch.json or any other options mentioned before. Just select the HARDWARIO logo on the side panel and select Attach Debugger or Build + Flash (Debugger) option.