Debug
Most of the code is possible to debug with Zephyr logging functions like LOG_INF, LOG_HEXDUMP_INF and others.
However, sometimes it is necessary to do proper low-level hardware debugging with single stepping and memory view.
You can easily do that with nRF Connect for VS Code extension in your VSCode.
Install
In VSCode hit Ctrl + P and type ext install nordic-semiconductor.nrf-connect, hit enter.
Debugging
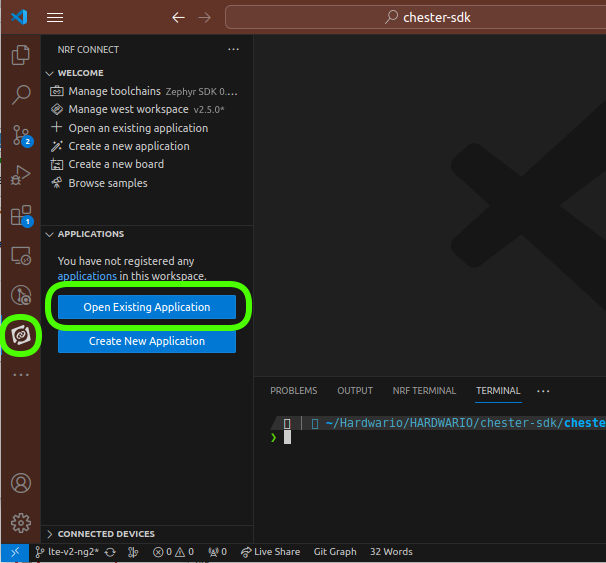
- Open the nRF Connect for VS Code extension, click
Open Existing Applicationand choose a folder of the application, where you usually callwest build.
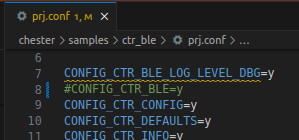
- In the project
prj.confcomment with#or removeCONFIG_CTR_BLE=y. BLE is timing sensitive and when enabled, debugging don't work correctly.
-
In the left panel in Applications section, click + Add build configuration
-
In the Board option select
chester_nrf52840. Set Optimization level to Optimize for debugging (-Og). Then click Build Configuration button on the bottom. The project is built. -
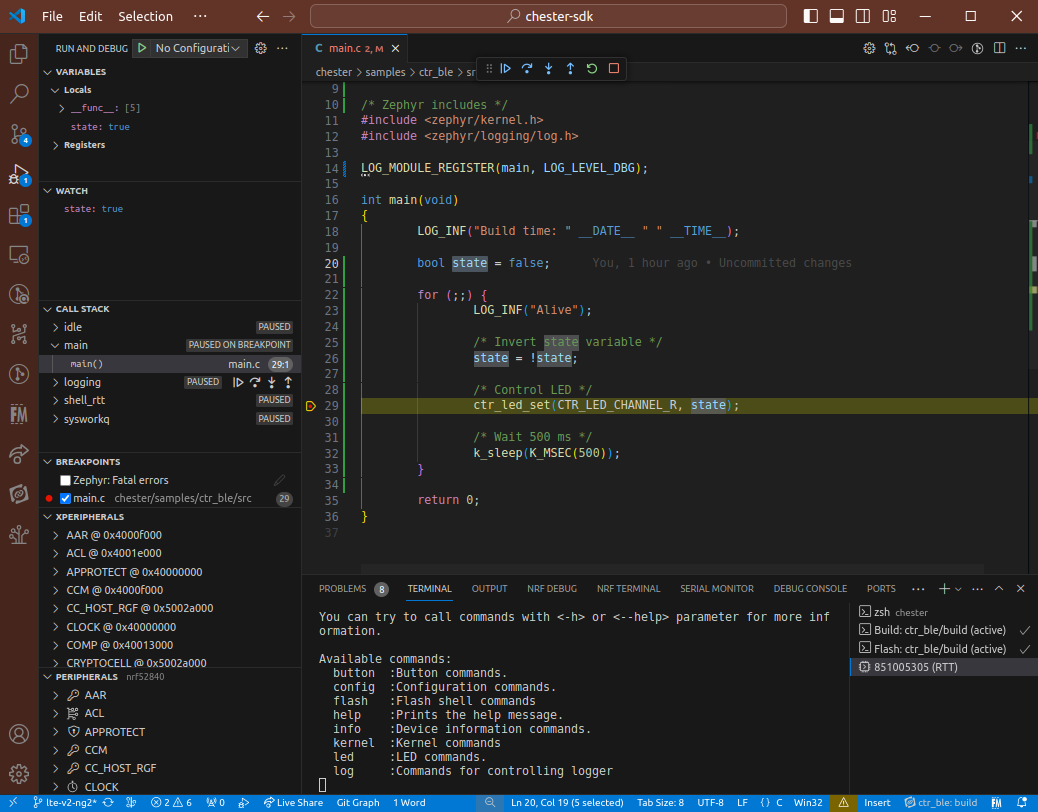
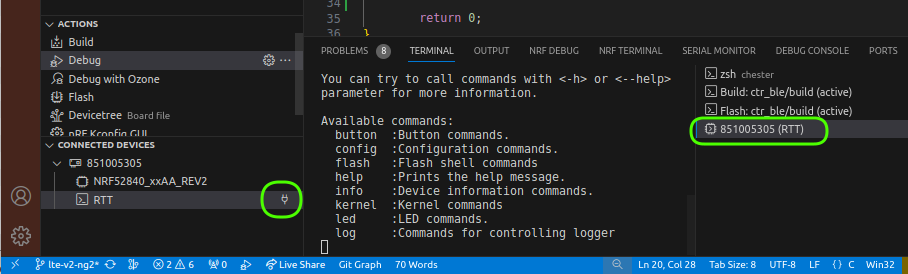
In the left panel in Actions click on the Debug and start debugging your code.
Do not use Erase board or any other similar option. CHESTER uses UICR region to save serial number and communication keys. If you erase that, you will need to recover PIB data.
For erasing the board use HARDWARIO CLI erase command which keeps the UICR regions.
Shell over RTT
In the Connected devices left panel, you can open RTT communication with the device. It uses channel 0 which is Zehpyr shell. You can type commands to the terminal. The second RTT channel with logs is not displayed here.
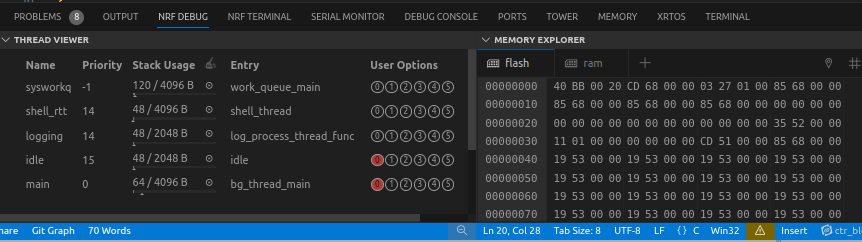
Threads
In the NRF DEBUG tab you can inspect threads and memory.